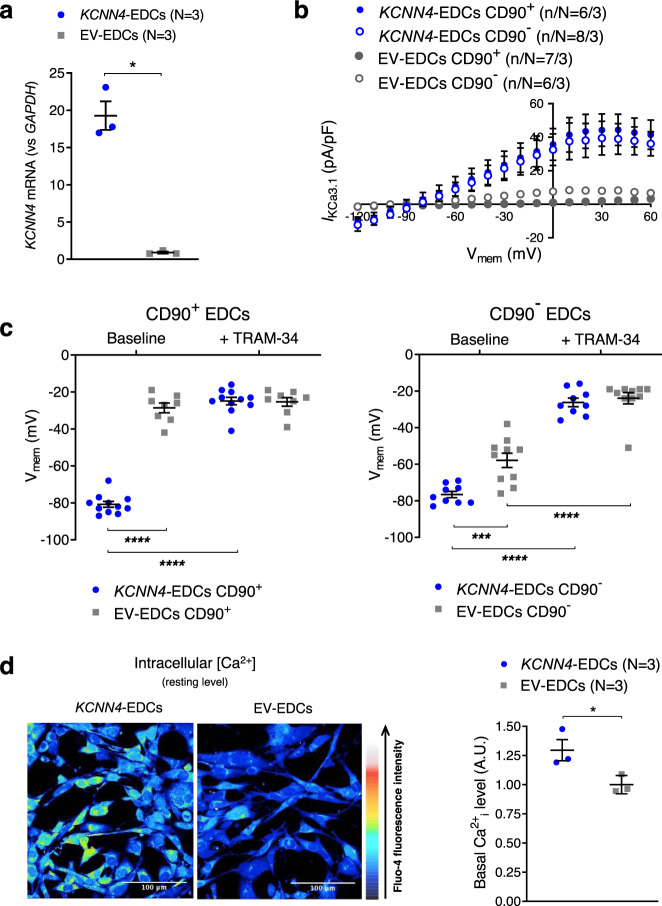
Fig. 3. Effect of KCNN4-gene transfer on IKCa3.1 and membrane potential of EDCs.
a Mean ± SEM KCNN4-gene expression in EDCs following lentivirus-mediated KCNN4-gene transfer or empty vector (EV; multiplicity of infection = 20). Circles = KCNN4-transduced EDCs, squares = EV-EDCs. b I–V relationship of IKCa3.1 currents recorded under various experimental conditions. Blue symbols = KCNN4-transduced EDCs, gray symbols = EV-EDCs. Filled symbols = CD90+, open symbols = CD90−. c Resting potential of EDCs under various experimental conditions, before and after exposure to 1 µmol/L TRAM-34. Blue symbols = KCNN4-transduced EDCs, gray symbols = EV-EDCs. d Representative Fluo-4 images in EV- and KCNN4-transduced EDCs overexpression on intracellular [Ca2+]. Data in b–d are shown as individual points, along with mean and SEM. Paired two-sided Student t-test; N = biological samples (panel a); two-way repeated-measures ANOVA with individual-mean comparisons by Bonferroni-corrected two-sided t-tests; n/N = cells/cell lines per group (panel c). Blue symbols = KCNN4-transduced EDCs, gray symbols = EV-EDCs. Open circles = CD90−, closed circles = CD90+. EDC explant-derived cell, EV empty vector, min minutes, Vmem membrane potential. *P < 0.05, ***P < 0.001, ****P < 0.0001. For precise P values, see Supplemental Source Data and Statistics file.

