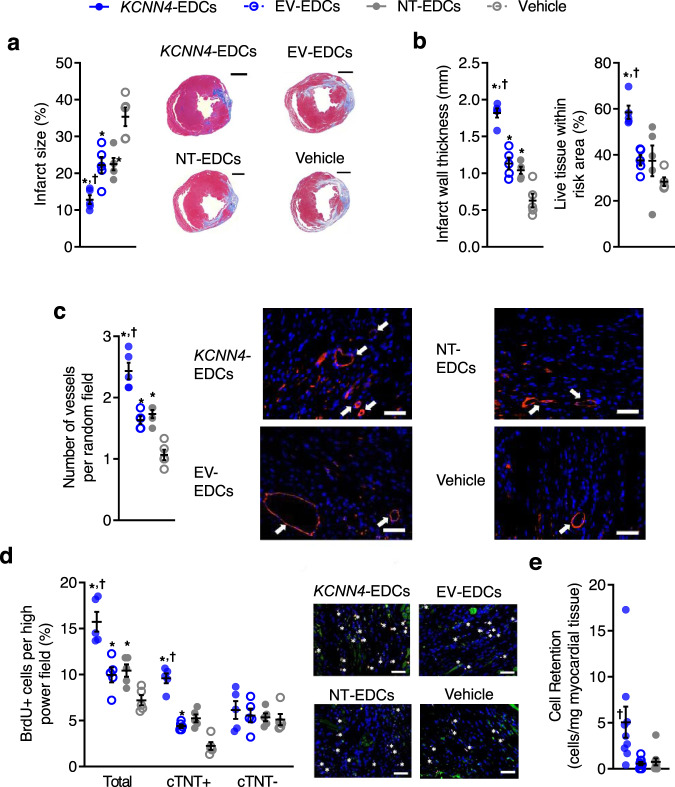
Fig. 6. Effects of KCNN4 overexpression on infarct properties, neo-angiogenesis, cardiomyogenesis, and long-term engraftment.
a Scar size analysis 4 weeks after LCA ligation (n = 5 biological replicates). Scale bar, 1000 µm. b Quantification of infarct wall thickness and viable tissue within the risk area (n = 5 biological replicates). c Vessel density within the peri-infarct area as indicated (white arrows) using isolectin B4 (red) and 4′,6-diamidino-2-phenylindole (DAPI; blue) immunohistochemistry (n = 5 biological replicates). Scale bar, 100 µm. d The total number of BrdU positive cells (white stars), proliferating cardiomyocytes (BrdU+/cTnT+), and noncardiomyocyte cells (BrdU+/cTnT−) quantified using random field analysis of immunohistochemistry staining with BrdU (red), cTNT (green) and DAPI (blue; n = 5 biological replicates). Scale bar, 100 µm. e Quantitative PCR analysis for human ALU sequences 21 days after EDC injection (n = 9 biological replicates). Significance is indicated in all panels using *P < 0.05 vs. vehicle-treated mice, †P < 0.05 vs. EV- and NT-EDCs treated mice. For precise P values, see Supplemental Source Data and Statistics file. Data are shown as individual points, along with mean and SEM. All data were analyzed using a one-way ANOVA with individual-mean comparisons by Bonferroni multiple two-tailed comparisons test. Blue filled symbols = KCNN4-transduced EDCs, blue open symbols = EV-EDCs, gray filled symbols = NT-EDCs, gray open symbols = Vehicle. EDC explant-derived cell, EV empty vector, min minutes, Vmem membrane potential.

