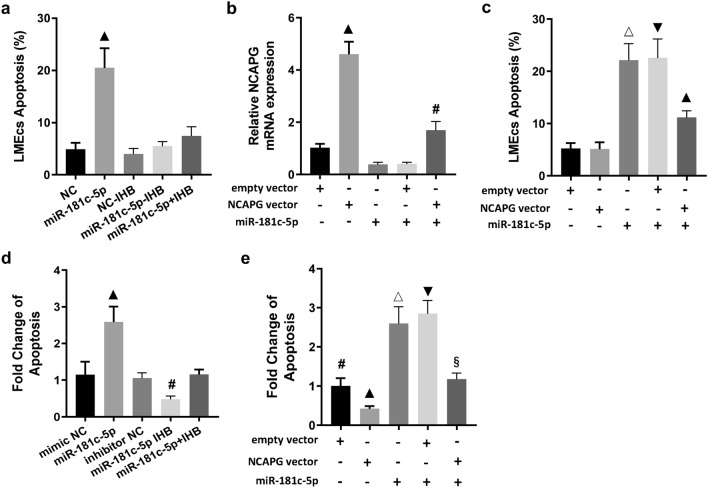
Figure 4.
MiR-181c-5p promoted hyperoxia-induced apoptosis of LMECs by inhibiting the expression of its target gene NCAPG. (a) Comparison of apoptosis of LMECs treated with miR-181c-5p mimic (miR-181c-5p) or inhibitor (IHB) and the corresponding negative control sequences (NC, NC-IHB). ▲: p < 0.001 versus all other groups. (b) Comparison of expression levels of NCAPG mRNA in LMECs with different treatments. ▲: p < 0.001 versus all other groups; #: p < 0.01 versus all other groups. (c) Comparison of apoptosis of LMECs with different treatments. △: p < 0.001 versus all other groups except for miR-181c-5p + empty vector group; ▼: p < 0.001 versus all other groups except for miR-181c-5p group; ▲: p < 0.001 versus all other groups. (d) Relative changes of apoptosis of hyperoxia-treated LMECs transfected with miR-181c-5p mimic (miR-181c-5p) or inhibitor (IHB) and the corresponding negative control sequences (NC, IHB-NC). ▲: p < 0.001 versus all other groups; #: p < 0.01 versus all other groups. (e) Relative changes of apoptosis of hyperoxia-treated LMECs transfected with miR-181c-5p or different vectors. #: p < 0.01 versus all other groups; ▲: p < 0.001 versus all other groups; △: p < 0.001 versus all other groups except for miR-181c-5p + empty vector group; ▼: p < 0.001 versus all other groups except for miR-181c-5p group; §: p < 0.001 versus all other groups except for empty vector group. Data are presented as mean ± SEM. One-way ANOVA analysis with Tukey's post hoc test was used for statistical analysis.

