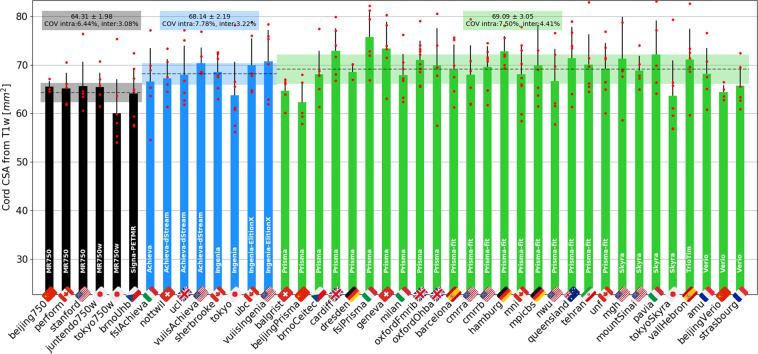
Fig. 10.
Results of multi-subject study for the T1w scan. As in the single subject study, the cross-sectional area of the SC was averaged between the C2 and C3 vertebral levels. Black, blue and green bars respectively correspond to GE, Philips and Siemens, with the manufacturer’s model indicated in white letters on each bar. The following participants were excluded from the statistics: balgrist01 (motion), beijingGE04 (motion), mniS06 (motion), mountSinai03 (participant repositioning), oxfordFmrib04 (participant repositioning), pavia04 (motion) and perform06 (motion).

