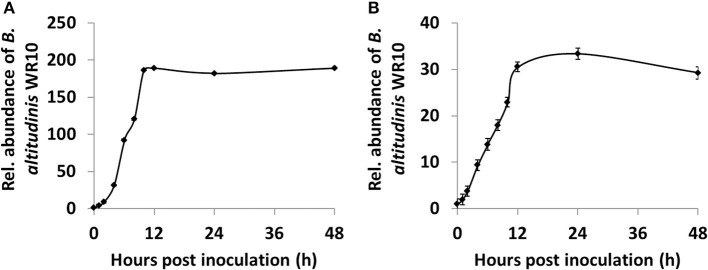
Figure 4.
Quantification of B. altitudinis WR10 in different wheat tissues during hydroponic coculture by qPCR assay. (A) The relative abundance of endophytic B. altitudinis WR10 in the root; (B) relative abundance of endophytic B. altitudinis WR10 in the sprout. At 0 phi, the relative abundances in different tissues were considered as 1. Fold changes were calculated by the 2ΔCq method, which uses the copy numbers of the GAPDH gene representing the abundance of B. altitudinis WR10. Data were mean of three repeats from the genomic DNA mixture of six seedlings.

