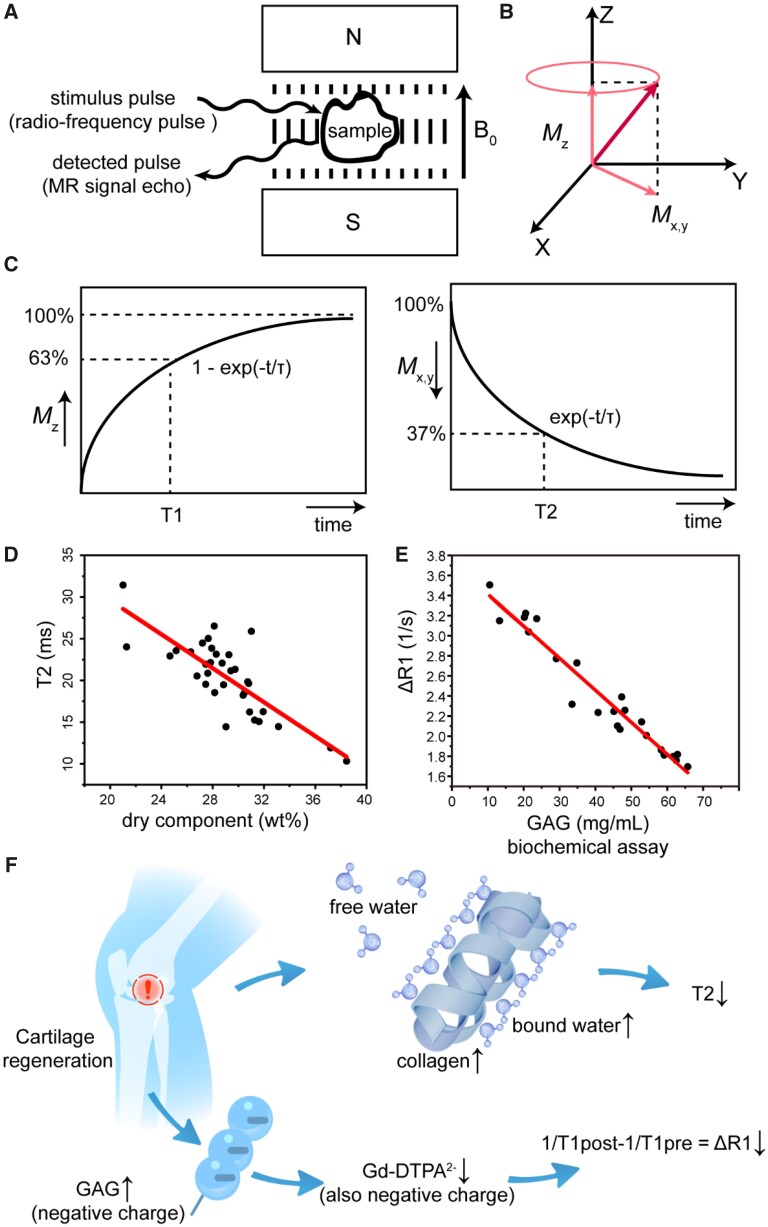
Figure 1.
Principles of magnetic resonance imaging of regenerative cartilage. (A) The NMR phenomenon appears when a system of nuclei in a static magnetic field experiences a radiofrequency pulse (RF). (B) Under the action of a 90° RF pulse with Larmor frequency, the magnetization vector is rotated from the z-axis to the xy-plane. After the RF pulse is removed, longitudinal magnetization (Mz) is restored owing to spin–lattice relaxation, and transversal magnetization (Mxy) is decayed owing to spin–spin relaxation. (C) The longitudinal relaxation time T1 represents the recovery of Mz to 63%, and the transversal relaxation time T2 represents the decay of the Mxy to 37%. (D) Correlation between the content of dry components in cartilage and the relaxation time T2. The richest dry component in cartilage is collagen. Data are used and replotted from Lüsse et al.[5] permitted by Elsevier Ltd with copyright 2001. The line comes from linear fitting. (E) Correlation of ΔR1 (△R1 = 1/T1post − 1/T1pre) and glycosaminoglycan (GAG). Excised human cartilage is obtained after total knee and hip replacement surgery. Data are used and replotted from Bursturn et al. [6] permitted by John Wiley and Sons with copyright 1999. The line comes from linear fitting. (F) Schematic presentation of the main dry components of cartilage (collagen and GAG) and change of magnetic resonance signals with tissue regeneration. Along with cartilage regeneration, the maturation of the collagen network leads to, albeit the decrease of the total water content (both free and bound), the increase of bound water and thus the decrease of T2; meanwhile, the increase of GAG in the regenerated cartilage leads to the decrease of the penetration of the negatively charged contrast agent Ga-DTPA2− into the tissue and thus the decrease of ΔR1

