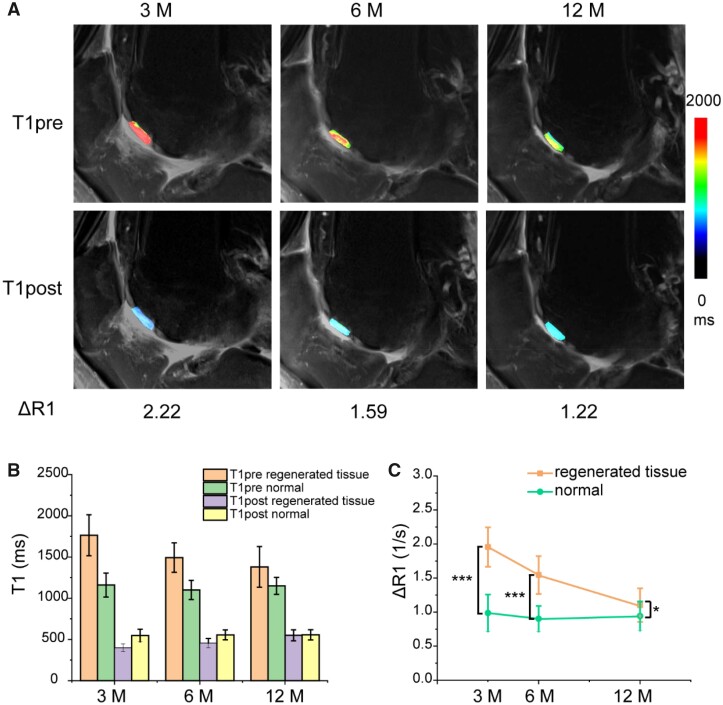
Figure 4.
(A) T1 maps before and after injection of the contrast agent Gd-DTPA2− in the same patient as in Fig. 3 at 3, 6 and 12 months after MACI. (B) The T1pre and T1post relaxation times of regenerated tissue and control cartilage at 3, 6 and 12 months after MACI. (C) The line picture shows a decrease of ΔR1 of regenerated tissue with time. The data are shown as mean ± standard deviation and treated by one-way ANOVA analysis. The differences are marked ‘***’ for P < 0.001 and ‘*’ for 0.01 < P < 0.05

