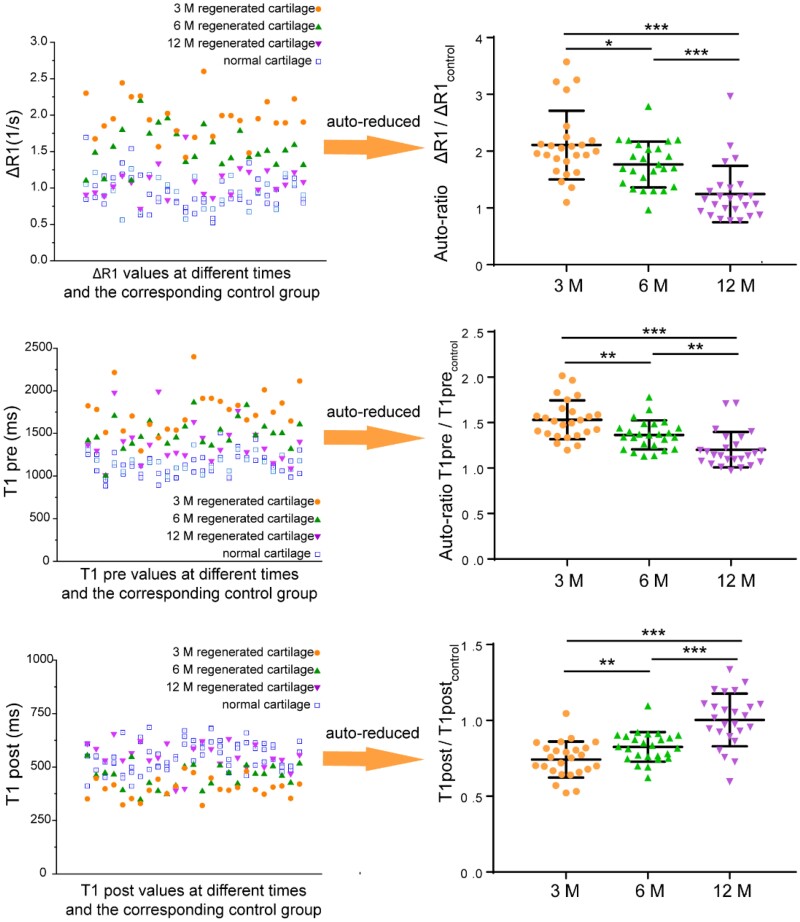
Figure 7.
T1-pertinent results and the reduction of the regenerated sites over the corresponding neighbor healthy control in the same patients and sites. ΔR1 and T1 values before and after injection of the contrast agent in the same patient at 3, 6 and 12 months after MACI (left). These values deviated more from normal in the early stage of cartilage regeneration (3 M) and are close to normal in 12 M. The difference of ΔR1 value is the most obvious in 3 M. Statistical diagrams of auto-ratio values indicate that the ratio of the regenerated tissue to the adjacent normal tissue can be used to evaluate the regeneration effect. There were 25 lesions based on 18 patients. The data are shown as mean ± standard deviation and treated by one-way ANOVA analysis. It is considered to have a significant difference when the P value is less than 0.05. The differences are marked ‘***’ for P < 0.001, ‘**’ for 0.001 < P < 0.01 and ‘*’ for 0.01 < P < 0.05

