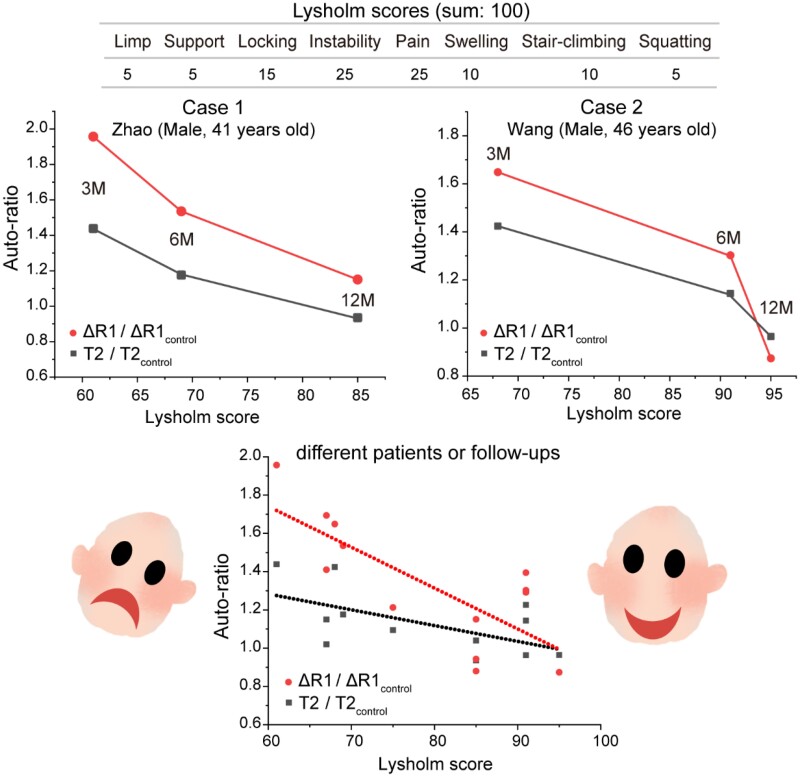
Figure 8.
The relationship between the auto-ratios to reflect the MRI evaluation of cartilage regeneration and the Lysholm scores to reflect the global clinical performance. The cases are from Supplementary Table S2. With the regeneration of cartilage, the Lysholm score keeps rising and the auto-ratio values gradually decrease and tend to unity. The lines in the bottom figure come from linear fitting of clinical Lysholm scores and auto-ratio data for different patients

