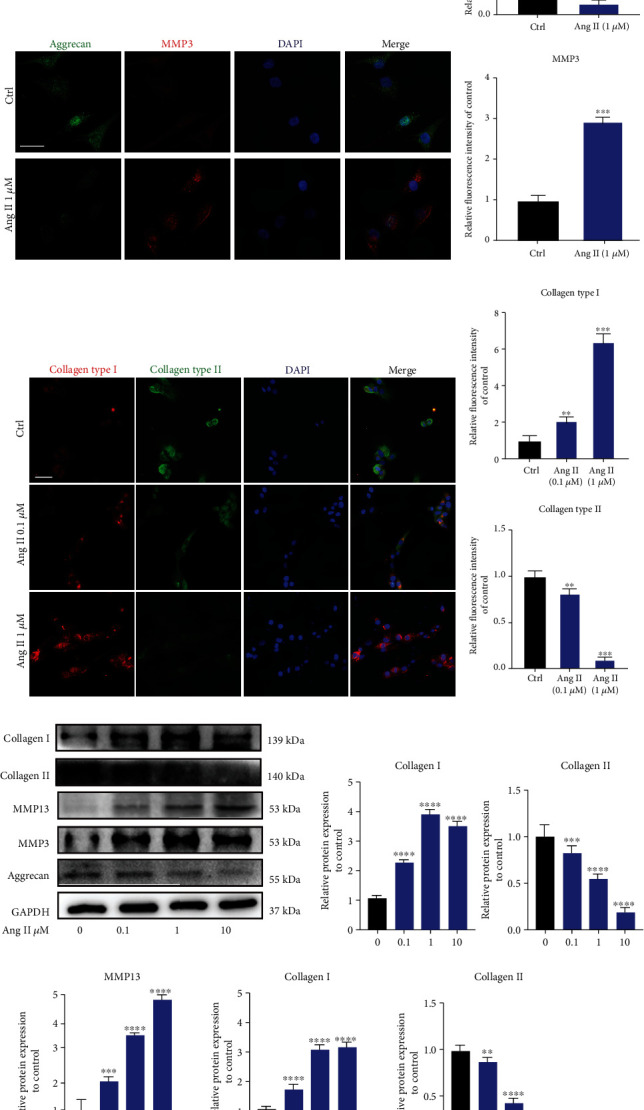
Figure 5.

Angiotensin II induced degeneration and fibrosis phenotype in human NP cells in vitro. (a) Immunofluorescence results for the expression of aggrecan and MMP3 in human NP cells induced by Ang II. Scale bar = 50 μm. (b) The relative expression of aggrecan and MMP3 was quantified (n = 3). (c) Immunofluorescence results for the expression of fibrosis-related proteins, collagen types I and II, in human NP cells induced by Ang II. Scale bar = 50 μm. (d) Quantitative results for collagen types I and II were presented as graph (n = 3). (e, f) Western blot for the expression of IDD-related proteins in the human NP tissue (n = 3). p < 0.05, ∗∗p < 0.01, ∗∗∗p < 0.001, ∗∗∗∗p < 0.0001.
