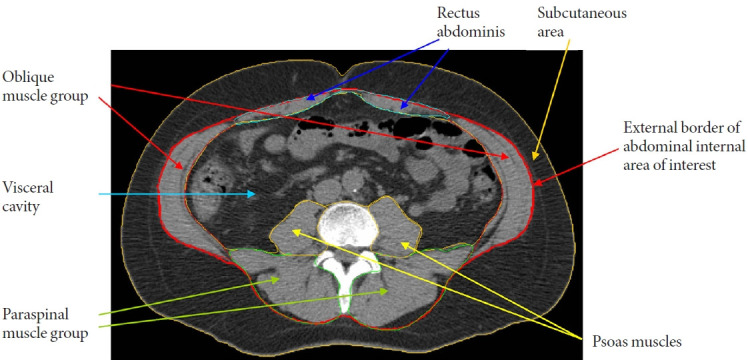
Fig. 1.

Representation of areas of interest (adipose tissue and muscle measures) derived from abdominal computed tomography (CT) scans in the Multi-Ethnic Study of Atherosclerosis (MESA) cohort. The morphologically discrete tissues measured during CT image processing are: subcutaneous area which lies between the dermis and the fascia of the abdominal muscles; visceral cavity area with the internal organs; and abdominal skeletal muscles. The specific muscle groups denoted by psoas muscles (yellow arrows), paraspinal muscles (green arrows), oblique muscles (red arrows), and rectus abdominis muscles (blue arrows). Adipose tissue is identified as being between –190 and –30 Hounsfield units (HU). Lean tissue is identified as being between 0 and 100 HU. Inter-muscular adipose tissue is the sum of the pixels within a given muscle fascia. Intramuscular fat is computed as the mean of the pixel HU values between 0 and 99 for a given muscle group, with a higher mean density value for muscle indicating less intramuscular fat.
