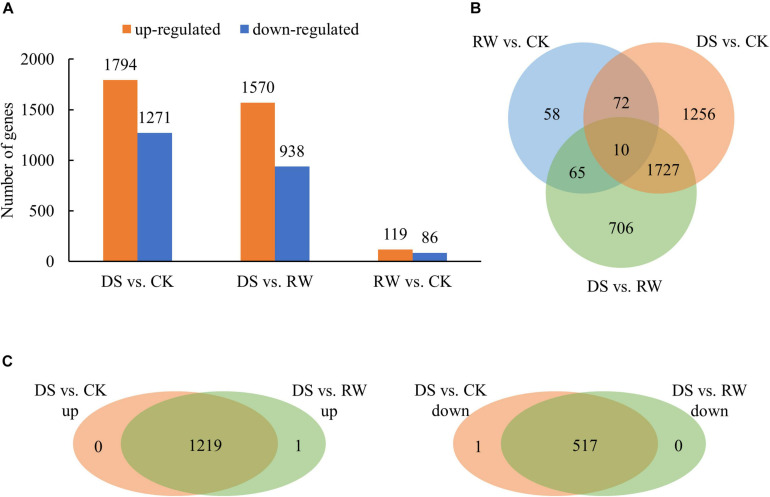
FIGURE 1.
Differentially expressed gene analysis for control (CK), drought stress (DS), and rewatering (RW) treatment in M. ruthenica. (A) The number of DEGs for the DS vs. CK, DS vs. RW, and RW vs. CK comparisons (p < 0.05); orange, upregulated DEGs; blue, downregulated DEGs. (B) Venn diagram of overlapping DEGs among the three comparisons. (C) Venn diagrams to illustrate the overlapping DEGs with upregulated expression between the DS vs. CK comparison and the DS vs. RW comparison, and the overlapping DEGs with downregulated expression.

