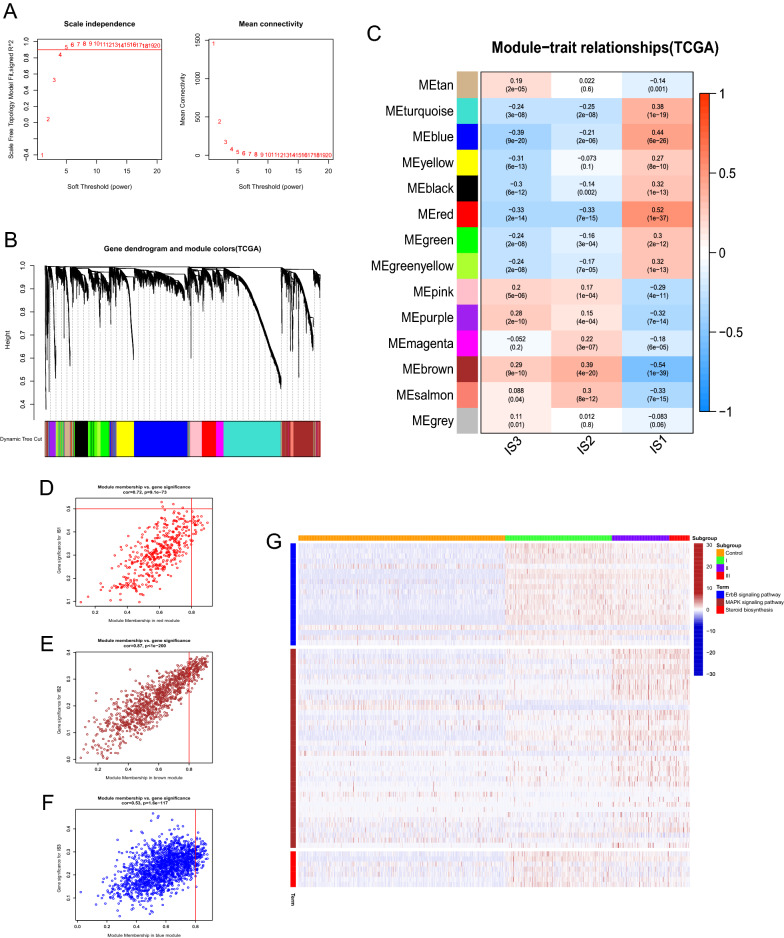
Fig. 6.
WGCNA of DEGs between different immune subtypes in TCGA-LGG. A Scale-free fit index and mean connectivity for various soft-thresholding powers (β). B DEGs were clustered using hierarchical clustering with a dynamic tree cut and merged based on a dissimilarity measure (1-TOM). C Relationship analysis between Traits and modules. Scatterplot of gene significance (GS. group) versus module membership (KME) for the D red, E brown, and F blue module. G Heatmap showed the activity of KEGG terms of blue, brown, and red module among non-tumor, IS1, IS2, and IS3 group, the deeper red color indicates the higher degree of KEGG terms enriched in each sample

