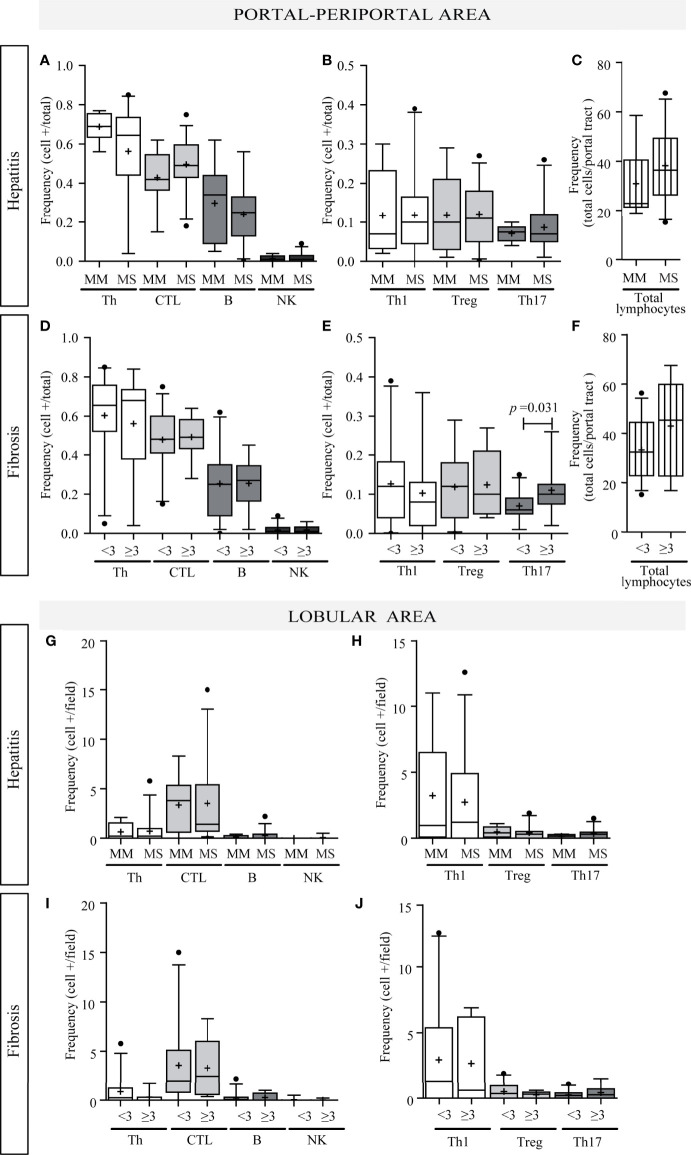
Figure 3.
Relationship between intrahepatic infiltrate and liver damage. Portal–periportal cell population frequencies related to hepatitis (A–C) and fibrosis severity (D–F). Lobular cell population frequencies related to hepatitis (G, H) and fibrosis severity (I, J). Th, CTL, B lymphocytes and NK cell (A, D, G, I); Th subpopulation (B, E, H, J); and total portal lymphocytes (C, F). MM, minimal–mild; MS, moderate–severe hepatitis. Advanced fibrosis (F≥3) according to METAVIR. The results are depicted in box plots. Horizontal lines within boxes indicate medians. Horizontal lines outside the boxes represent the 5 and 95 percentiles. Mean is indicated as +. Mann–Whitney U test was used to compare all data sets, except for portal–periportal CTL, B, Th1, and Treg cells vs. hepatitis severity, and CTL and B cell vs. fibrosis severity for which Student’s t-test was applied.

