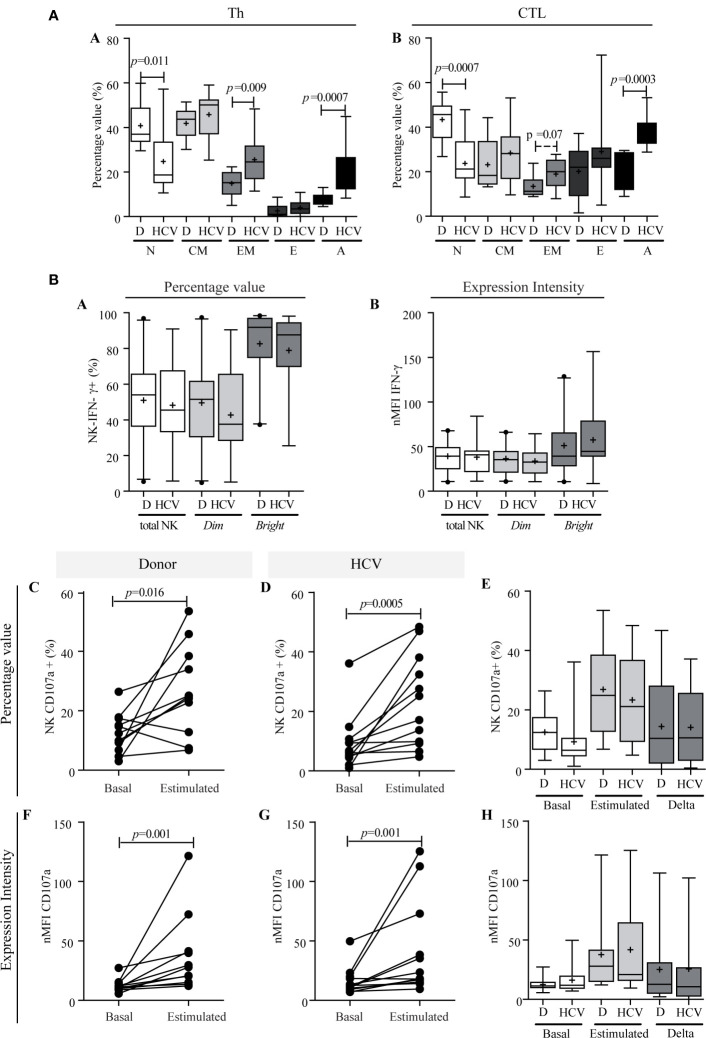
Figure 5.
T lymphocyte differentiation and functional characterization of NK cells. (A) Comparison of lymphocytes differentiation stages between donors and patients. Th (a) and CTL (b). Results are expressed as percentage values. N, naïve; CM, central memory; EM, effector memory; E, effector; A, activated. Student’s t-test was used to compare all data sets except for naïve Th and activated Th, and effector CTL for which Mann–Whitney U test was applied. Panel (B) IFN-γ production capacity (a, b) and degranulation activity of NK cells (c–h). IFN-γ production of NK cells in patients and donors (a, b). Percentage values (a), and intensity of expression (b). CD107a expression in total NK cells in percentage values (c–e) and in intensity of expression (f–h). Comparison of the response between basal conditions and before the stimulus per case in donors (c and f) and in patients (d, g). Comparison of basal CD107a expression in total NK cells, stimulated and magnitude of response (delta) between donor vs. patient (e and h). Results are expressed as percentage values (c–e) and intensity of expression (f–h). D, donor. When it corresponds, the results are depicted in box plots. Horizontal lines within boxes indicate medians. Horizontal lines outside the boxes represent the 5 and 95 percentiles. Mean is indicated as +. Mann–Whitney U test (a, b, e, h) and Wilcoxon test (c, d, f, g) were used to compare all data sets. The analysis of absolute values displayed similar results to the percentage values, but it is not shown to simplify their visualization.

