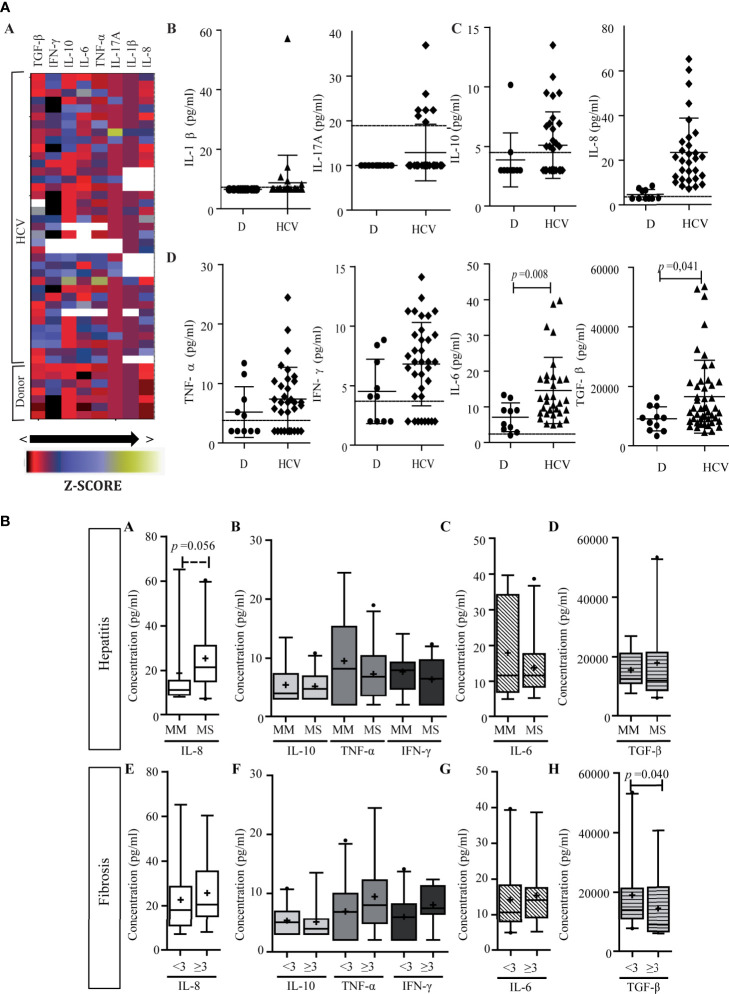
Figure 7.
Peripheral cytokine level. (A) Heat map of peripheral cytokine expression levels (a) and comparison of circulating cytokine levels between patients and donors (b–d). (a) Each row corresponds to the cytokine indicated at the top, and each column represents one case. The data are normalized, and the results are expressed as a Z-score (Xi-/SD), which is assigned a color scale from black (lowest values) to yellow (highest values). The white boxes correspond to the cases without data. (b–d) Cytokine levels in patients and donors: IL-1β and IL-17A (b), IL-10 and IL-8 (c), and TNF-α, IFN-γ, IL-6, and TGF-β (d). D donor. Results are plotted on dot diagrams, the middle horizontal line indicates the mean, and the outer horizontal lines represent the SD. Mann–Whitney U test was used to compare data sets. (B) Relationship between circulating cytokine levels and liver damage. Circulating levels of cytokines in relation to hepatitis (a–d) and fibrosis (e–h) severity. MM, minimal–mild; MS, moderate–severe hepatitis. Advanced fibrosis (F≥3) according to METAVIR. The results are depicted in box plots. Horizontal lines within boxes indicate medians. Horizontal lines outside the boxes represent the 5 and 95 percentiles. Mean is indicated as +. Mann–Whitney U test was used to compare data sets.

