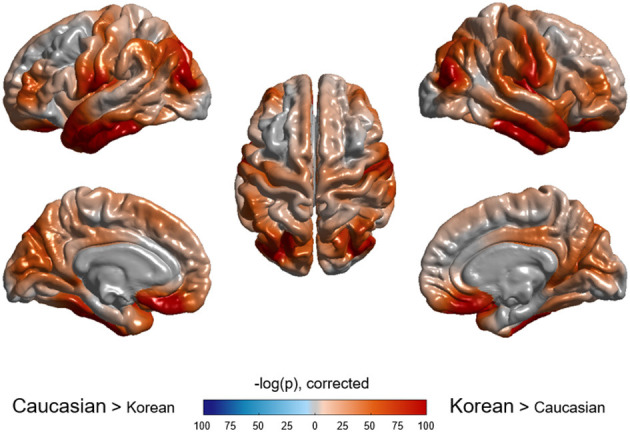
Figure 3.

Vertex-wise comparison of cortical volume between Caucasian and Korean normal controls. Korean elderly people were bigger in cortical volume than Caucasians. The p-value of ethnicity as a predictor was computed at each vertex based on the regression model described in the method section.
