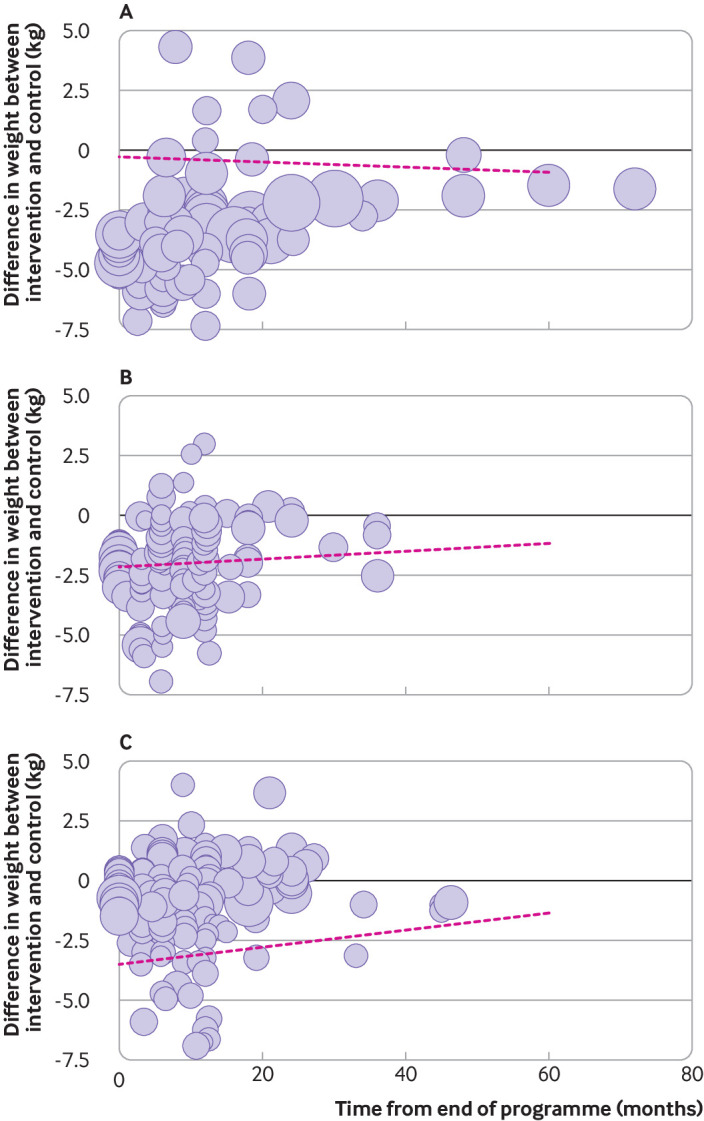
Fig 2.

Rate of change in weight after end of behavioural weight management programme, by weight loss during the programme. Difference in weight at end of programme between intervention and control groups: A, up to −1.5 kg; B, −1.4 to −3 kg; C, −3.1 to −5 kg. Graphs are illustrative only and analyses are based on mixed models. Lines are based on changes within trials, and because the points mapped represent different trials, the lines will not necessarily be visually consistent with the mapped points. In sensitivity analyses, removing studies at high risk of bias (eTable 6), univariate analyses were not substantially different with the exception that the association between partial meal replacements and regain in weight was stronger, with confidence intervals excluding the original estimate (0.15 kg/month (95% confidence interval 0.087 to 0.21) v 0.035 kg/month). In a post hoc analysis, a similar pattern was found when only studies at low risk of bias were included; univariate analyses were significantly different only for partial meal replacements where the point estimate and confidence intervals were the same as in the sensitivity analysis including studies at low and unclear risk of bias
