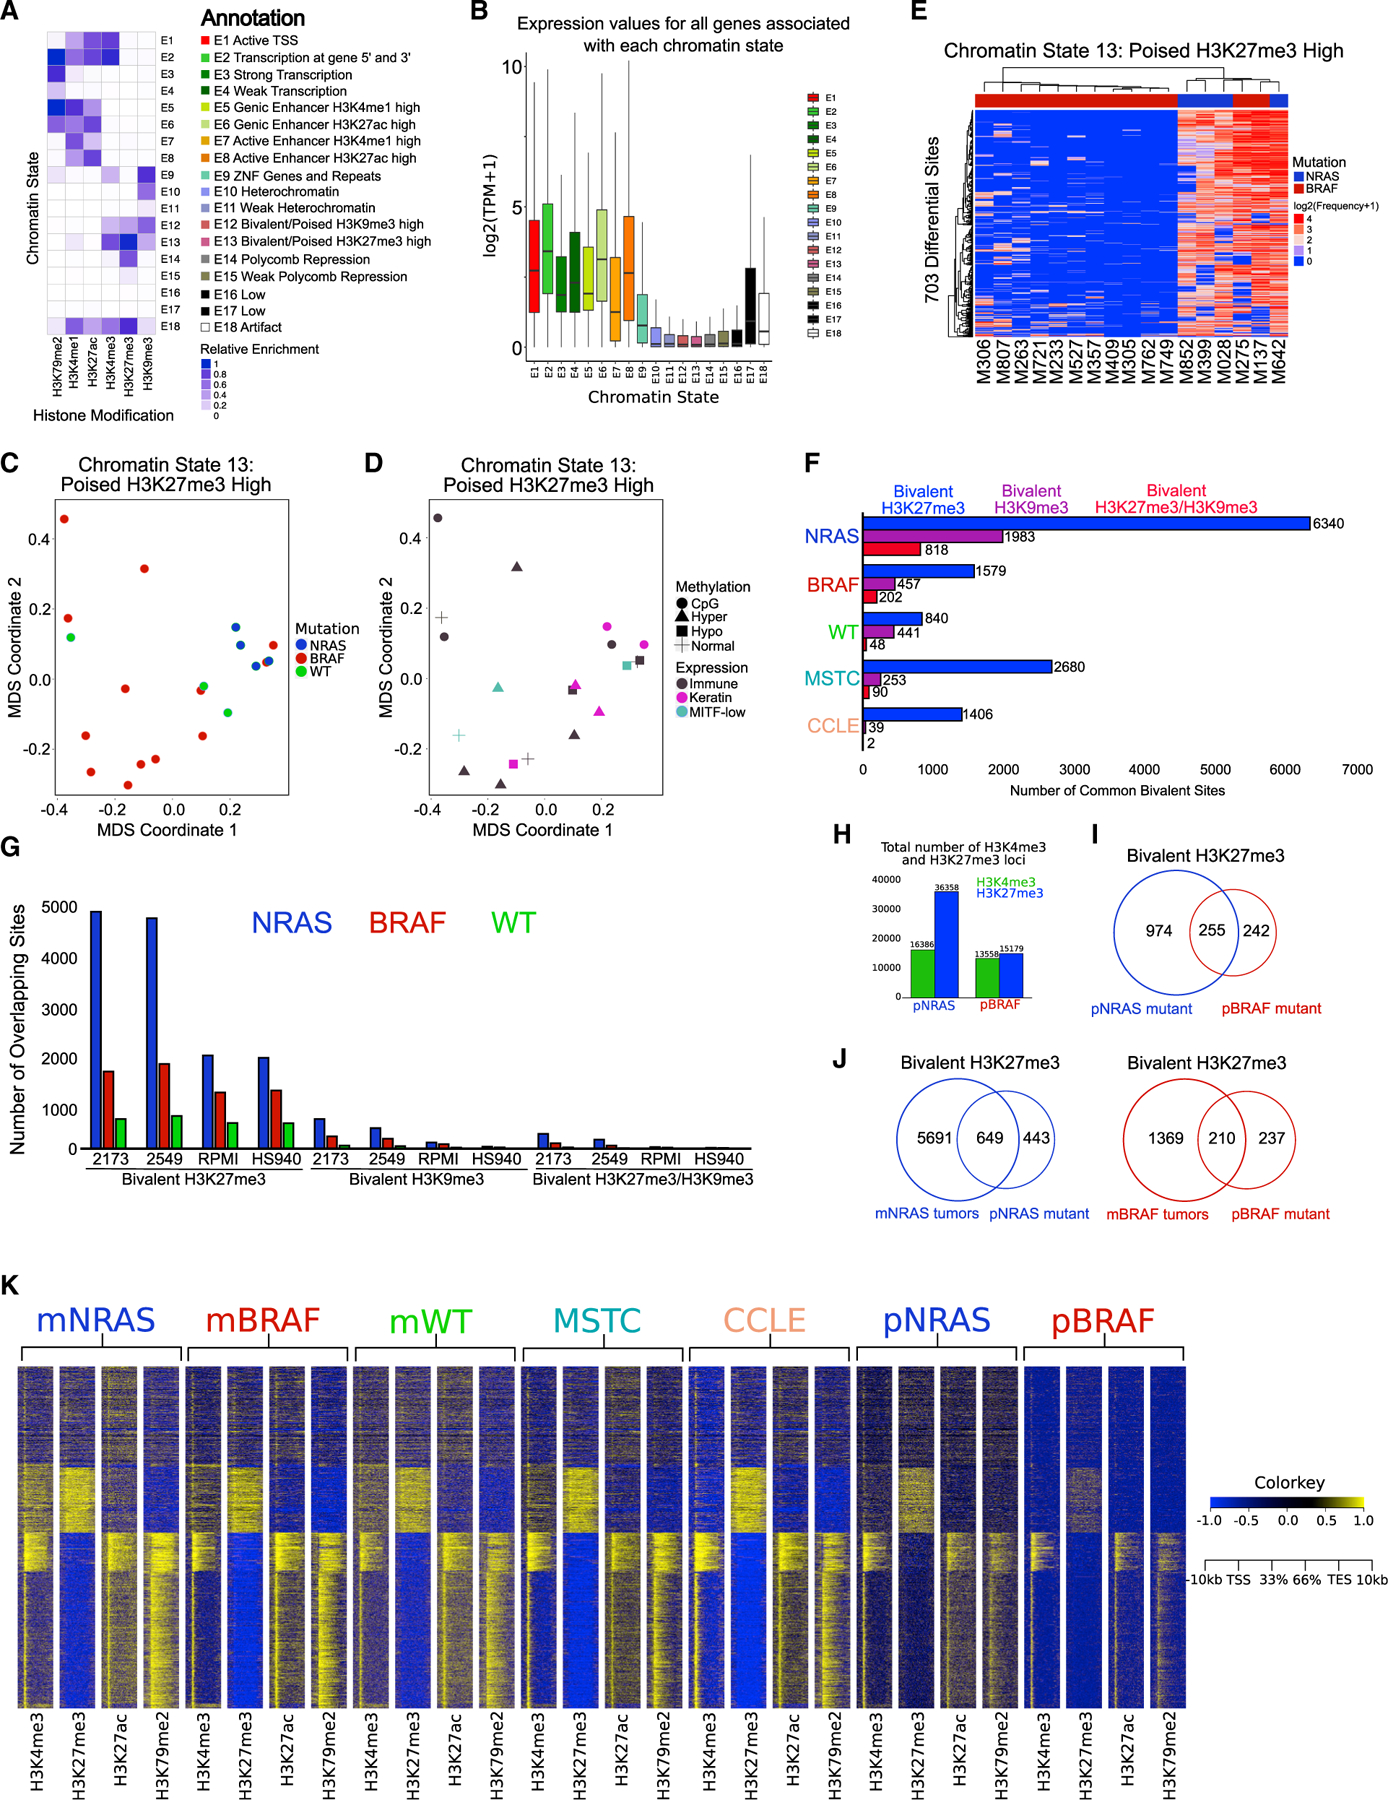
Figure 1. Bivalent H3K27me3 chromatin states are enriched in metastatic melanoma.

(A) Combinatorial chromatin state definitions and histone mark probabilities identified in 20 metastatic melanoma tumor samples using the ChromHMM algorithm.
(B) Boxplot illustrating mean gene expression levels from RNA-seq based on genomic regions overlapping with each chromatin state.
(C and D) MDS analysis of chromatin state E13 (poised H3K27me3 high) annotated by mutation (NRAS, BRAF, WT). (D) RNA expression (immune, keratin, MITF-low) and DNA methylation (normal, CpG, hyper, hypo) classifications from The Cancer Genome Atlas.
(E) Heatmap displaying differentially regulated regions (false discovery rate [FDR] < 0.05) of chromatin state E13 (poised H3K27me3 high) between NRAS and BRAF tumor subtypes. p values were calculated using a Wilcoxon test.
(F) Common bivalent H3K27me3 (H3K4me3 + H3K27me3), bivalent H3K9me3 (H3K4me3 + H3K9me3) and bivalent H3K27/H3K9me3 (H3K4me3 + H3K27me3 + H3K9me3) loci in melanoma tumor subtypes and melanoma short-term cultures (MSTCs) and CCLE lines.
(G) Co-occupancy analysis of common bivalent associated loci in melanoma tumor subtypes directly overlapping bivalent loci in representative MSTCs or CCLE lines.
(H) Barplot of H3K4me3 and H3K27me3 associated loci in isogenic mutant melanocytes harboring an NRAS (pNRAS) or BRAF (pBRAF) mutation.
(I) Venn diagram analysis of bivalent loci in pNRAS and pBRAF isogenic mutant melanocytes.
(J) Venn diagram analysis of bivalent loci in NRAS and BRAF mutant melanoma tumors with isogenic mutant melanocytes harboring an NRAS or BRAF mutation.
(K) Heatmap of H3K4me3 and H3K27me3 signal at −10 to +10 kb around transcription start sites (TSSs) of all ensemble genes in NRAS mutant melanoma tumors (mNRAS), BRAF mutant melanoma tumors (mBRAF), WT melanoma tumors (mWT), MSTCs, CCLE cell lines, and isogenic mutant melanocytes harboring an NRAS or BRAF mutation.
See also Figures S1–S3 and Table S1.
