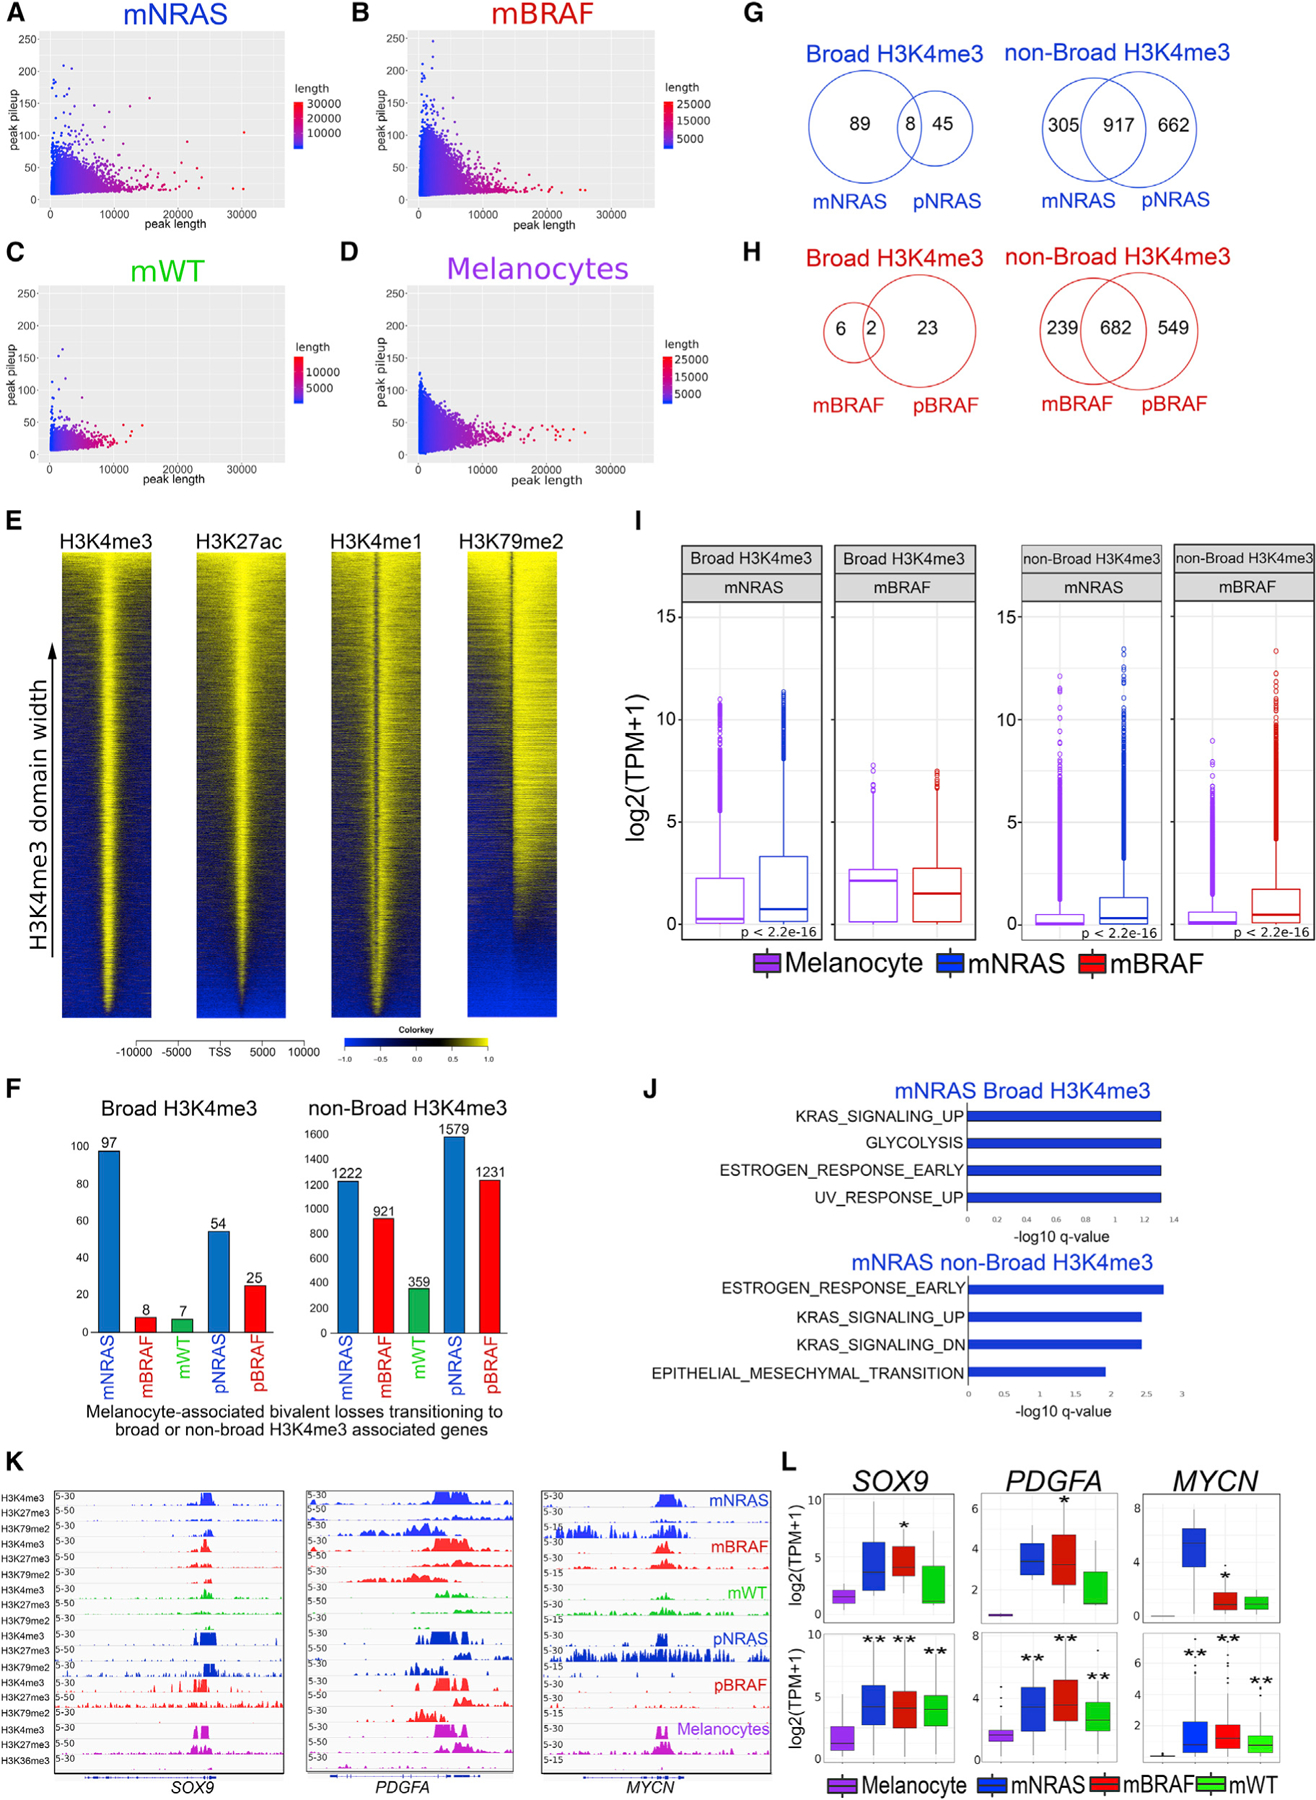
Figure 3. A subset of melanocyte-specific bivalent genes transition to transcriptionally active H3K4me3.

(A–D) Scatterplots of peak width (x axis) and height (y axis) from MACS2 broad peak calls (p value 1e–5) for H3K4me3 in mNRAS mutant tumors. (B) mBRAF mutant tumors, (C) mWT tumors, and (D) melanocytes from Roadmap.
(E) Heatmap of H3K4me3, H3K27ac, H3K4me1, and H3K79me2 signal at −10 to +10 kb around TSSs of ensemble genes based on H3K4me3 domain width in melanoma tumors.
(F) Barplot of bivalent H3K27me3 genes (±10 kb TSS-TES) that are lost in melanocytes and associated with broad or non-broad H3K4me3 in mNRAS, mBRAF, mWT melanoma tumor subtypes, and isogenic mutant melanocytes.
(G and H) Venn diagram of broad or non-broad H3K4me3 domains overlapping in mNRAS tumors and pNRAS melanocytes and (H) mBRAF tumors and pBRAF melanocytes.
(I) Boxplot displaying quantile normalized mean RNA expression profiles of mNRAS (n = 81) and mBRAF (n = 118) tumor subtypes and melanocytes (n = 86) based on broad or non-broad H3K4me3-associated genes identified in (G) and (H). p values were calculated using a Wilcoxon test.
(J) Top significant GSEA HALLMARK pathways based on bivalent H3K27me3 genes (±10 kb TSS-TES) that are lost in melanocytes and associated with broad or non-broad H3K4me3 domains in mNRAS tumor subtypes identified in (G).
(K) Genome browser views of ChIP-seq tracks for H3K4me3, H3K27me3, and active transcription (H3K79me2/H3K36me3) on the SOX9, PDGFA, and MYCN genes in mNRAS, mBRAF, mWT melanoma tumor subtypes, isogenic mutant melanocytes, and primary melanocytes from Roadmap.
(L) Boxplot displaying quantile normalized mean RNA expression profiles (log2 TPM) of the SOX9, PDGFA, and MYCN genes in melanocytes (n = 2) and melanoma tumor subtypes (NRAS = 4, BRAF = 13, WT = 3) with associated chromatin profiles (top) and in a large cohort of melanocytes (n = 86) and melanoma tumor subtypes (NRAS = 81, BRAF = 118, WT = 38 [bottom]). p values were calculated using a Wilcoxon test. *p < 0.05; **p < 0.0001.
