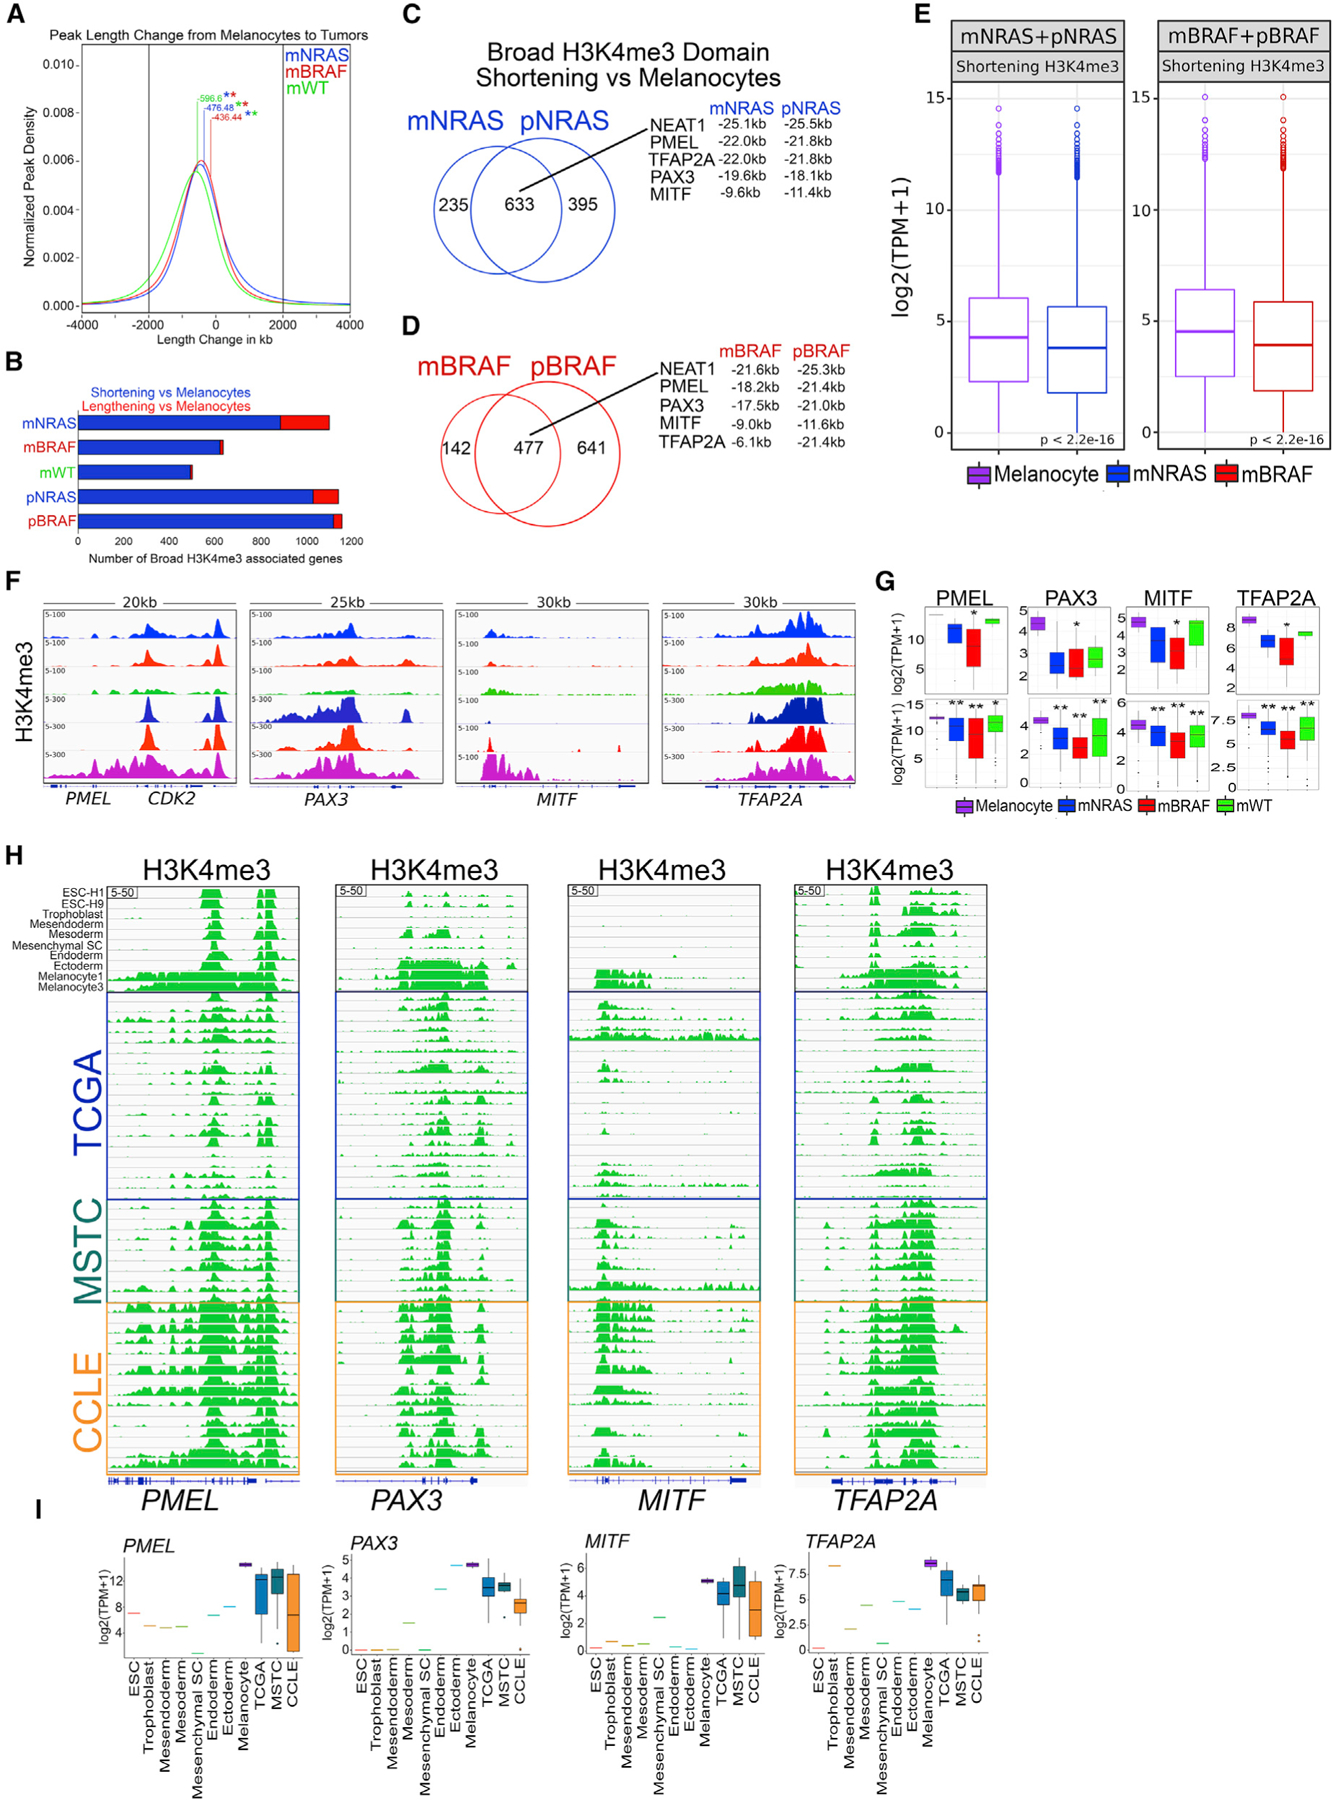
Figure 4. Broad H3K4me3 domain shortening correlates with transcriptional repression.

(A) Kernel density estimation plot displaying H3K4me3 peak length change (±2 kb) from melanocytes to melanoma tumor subtypes. Number denotes mean length change in kilobases between melanocytes and melanoma subtype. Asterisk denotes p value < 1e–50 between melanoma subtype length changes.
(B) Barplot of broad H3K4me3 promoter associated sites (−10 to +10 kb) displaying shortening or lengthening (±2 kb) in mNRAS, mBRAF, and mWT melanoma tumor subtypes and isogenic mutant melanocytes relative to primary melanocytes from Roadmap.
(C and D) Venn diagram analysis of broad H3K4me3 domains shortening (±2 kb) relative to melanocytes in mNRAS and pNRAS and (D) mBRAF and pBRAF samples.
(E) Boxplot displaying quantile normalized mean RNA-seq expression profiles from mNRAS (n = 81) and mBRAF (n = 118) melanoma tumor subtypes and melanocytes (n = 86) based on genes displaying shortening (±2 kb) of broad H3K4me3 domains identified in (C) and (D). p values were calculated using a Wilcoxon test.
(F) Genome browser view of ChIP-seq tracks displaying H3K4me3 on the PMEL, PAX3, MITF, and TFAP2A genes in mNRAS, mBRAF, and mWT melanoma tumor subtypes, isogenic mutant melanocytes, and primary melanocytes from Roadmap.
(G) Boxplot displaying quantile normalized mean RNA expression profiles (log2 TPM) of the PMEL, PAX3, MITF, and TFAP2A genes in melanocytes (n = 2) and melanoma tumor subtypes (NRAS = 4, BRAF = 13, WT = 3) with associated chromatin profiles (top) and in a large cohort of melanocytes (n = 86) and melanoma tumor subtypes (NRAS = 81, BRAF = 118, WT = 38 [bottom]). p values were calculated using a Wilcoxon test. *p < 0.05; **p < 0.0001.
(H) Genome browser view of ChIP-seq tracks for H3K4me3, on the PMEL, PAX3, MITF, and TFAP2A genes in ESC, trophoblast, mesendoderm, mesoderm, mesenchymal stem cells, endoderm, ectoderm, melanocytes from Roadmap and TCGA tumors, MSTCs, and CCLE cell lines.
(I) Boxplots displaying quantile normalized mean RNA expression profiles (log2 TPM) of the PMEL, PAX3, MITF, and TFAP2A genes in ESC, trophoblast, mesendoderm, mesoderm, mesenchymal stem cells, endoderm, ectoderm, melanocytes from Roadmap and TCGA tumors, MSTCs, and CCLE cell lines.
