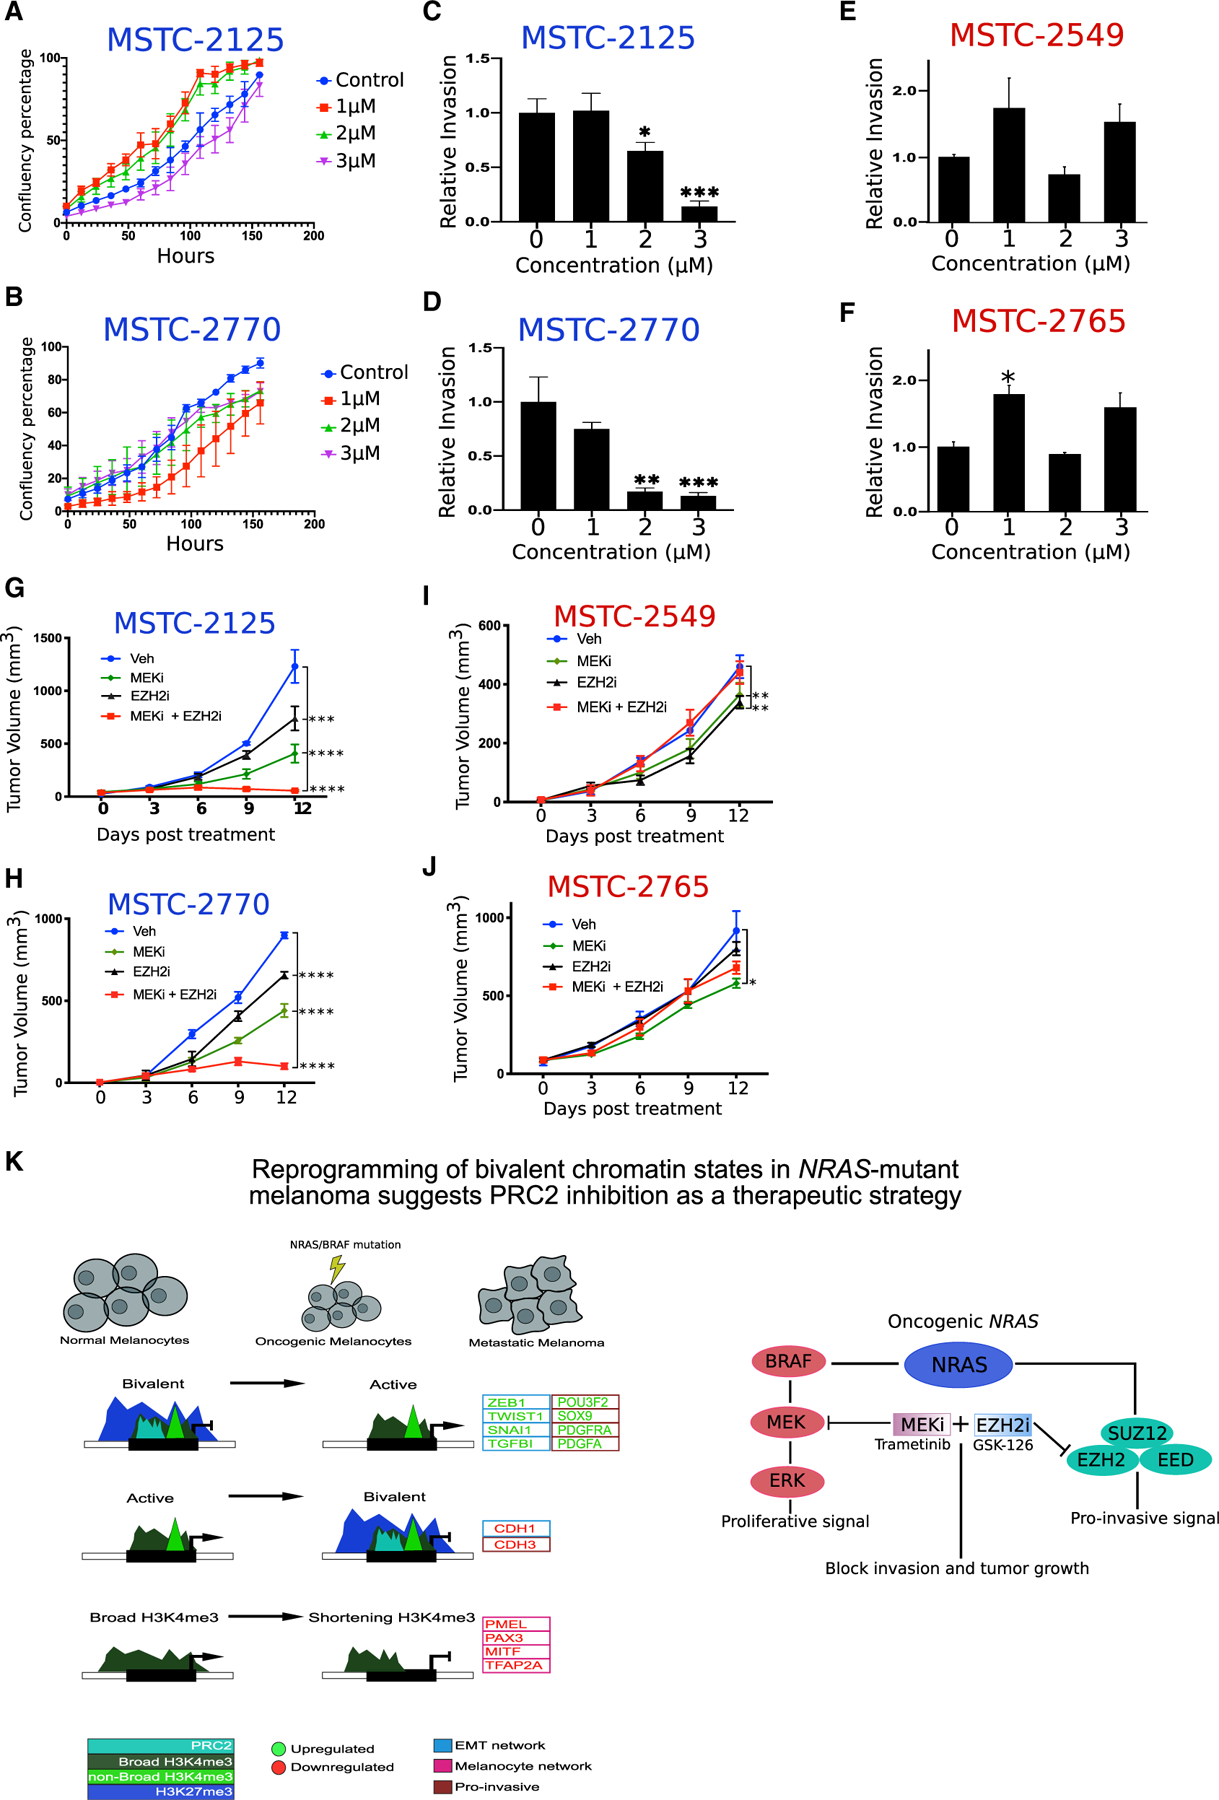
Figure 6. EZH2i and MEKi combination therapy decreases tumor burden in NRAS mutant melanoma.

(A and B) Proliferation assay representing confluence percentage in NRAS mutant MSTC cell lines 2125 and (B) 2770 treated for 14 days with GSK-126 or DMSO. Error bars represent mean ± SEM.
(C and D) Boyden chamber invasion assay in NRAS mutant MSTC cell lines 2125 and (D) 2770 treated for 14 days with GSK-126 or DMSO. p values were calculated using a t test. *p < 0.05; **p < 0.01; ***p < 0.001. Error bars represent mean ± SEM.
(E and F) Boyden chamber invasion assay in BRAF mutant MSTC cell lines 2549 and (F) 2765 treated for 14 days with GSK-126 or DMSO. p values were calculated using a t test. *p < 0.05. Error bars represent mean ± SEM.
(G–J) Tumor volume curves for NRAS mutant melanoma cultures (G) MSTC-2125 and (H) MTSC-2770 or BRAF mutant melanoma cultures (I) MSTC-2549 and (J) MSTC-2765, upon treatment with vehicle, MEK inhibitors (trametinib), EZH2 inhibitor (GSK-126), and a combination of MEK and EZH2 inhibitors (trametinib + GSK-126) (n = 5 for each arm). p values represent pairwise t test comparison between the experimental arm to vehicle treatment. *p < 0.05; **p < 0.01; ***p < 0.001; ****p < 0.0001. Error bars represent mean ± SEM.
(K) Model explaining potential mechanism in which switches of bivalent H3K27me3 domains on EMT-TFs, and shortening of H3K4me3 domains on melanocyte-specific cell-identity genes, control their expression during the switch from a proliferative to an invasive phenotype in metastatic melanoma. EMT-TFs and melanocyte-specific genes identified here are differentially expressed in alternate phenotypic states, with ZEB1, TWIST1, SNAI1, SOX9, PDGFRA, and PDGFA displaying high expression in a mesenchymal/invasive phenotype and CDH1, MITF, PAX3, PMEL, and TFAP2A displaying high expression in melanocytes/proliferative phenotype.
See also Figure S6.
