Figure 2.

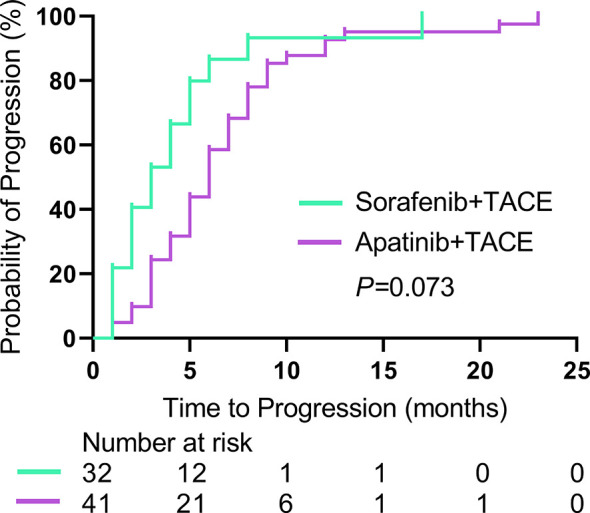
Kaplan-Meier curves show TTP in the sorafenib-TACE group and the apatinib-TACE group. TTP, time to progression; TACE, transarterial chemoembolization.

Kaplan-Meier curves show TTP in the sorafenib-TACE group and the apatinib-TACE group. TTP, time to progression; TACE, transarterial chemoembolization.