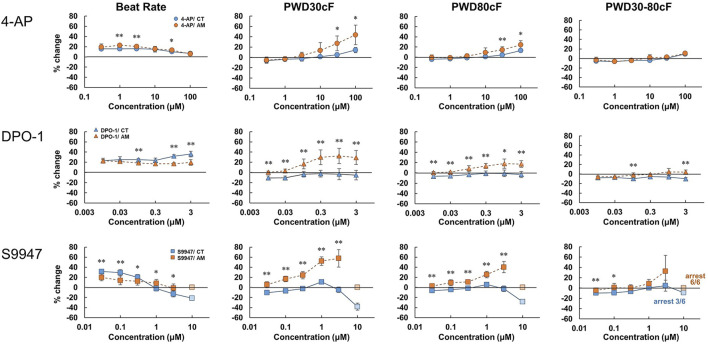
FIGURE 4.
Dose-response of IKur channel blockers in CT and AM. CT and AM were treated with various concentrations of 4-Aminopiridine (4-AP), DPO-1, and S9947, and MP was analyzed by FDSS/μCell imaging platform. Y-axis represents the percentage change from the value before test compound addition. Comparison of MP parameters: beat rate, PWD (Pulse width duration) 30cF, PWD80cF, PWD30-80cF in CT and AM. Error bars represent SD of the mean from the values of independent experiments. n = 6, *p < 0.05, **p < 0.01 for comparison of drug treatment of CT vs. AM. DPO-1 data: reuse from the conference paper with permission (Honda, 2020).

