
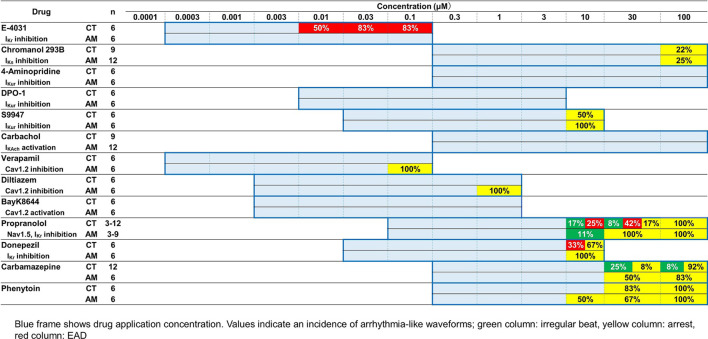
TABLE 2.
Effects of test compounds on arrhythmia-like waveforms in CT or AM. The blue frame indicates drug application concentration. Values indicate an incidence of arrhythmia-like waveforms; green column: irregular beat, yellow column: arrest, red column: EAD.
|