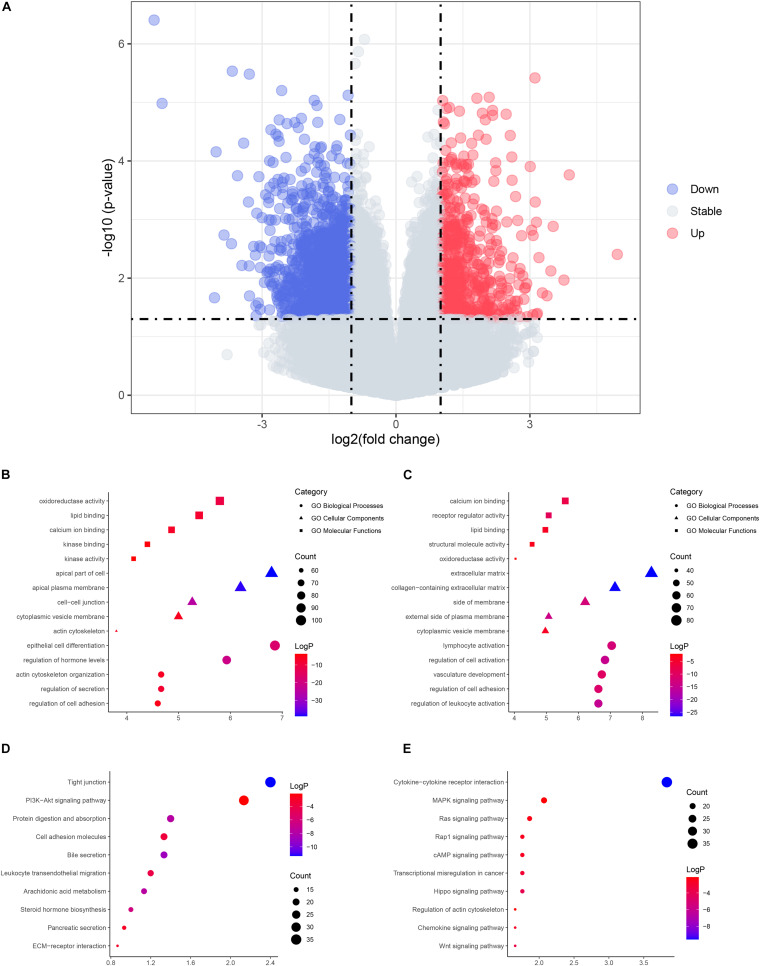
FIGURE 1.
The volcano plot and enrichment analysis of differentially expressed genes (DEGs). (A) Volcano plot of DEGs. Red, upregulated genes in cystic choledochal cysts (CCs); blue, downregulated genes in cystic CCs. (B) The enriched Gene Ontology (GO) terms of upregulated DEGs. (C) The enriched GO terms of downregulated DEGs. (D) The enriched pathways of upregulated DEGs. (E) The enriched pathways of downregulated DEGs.

