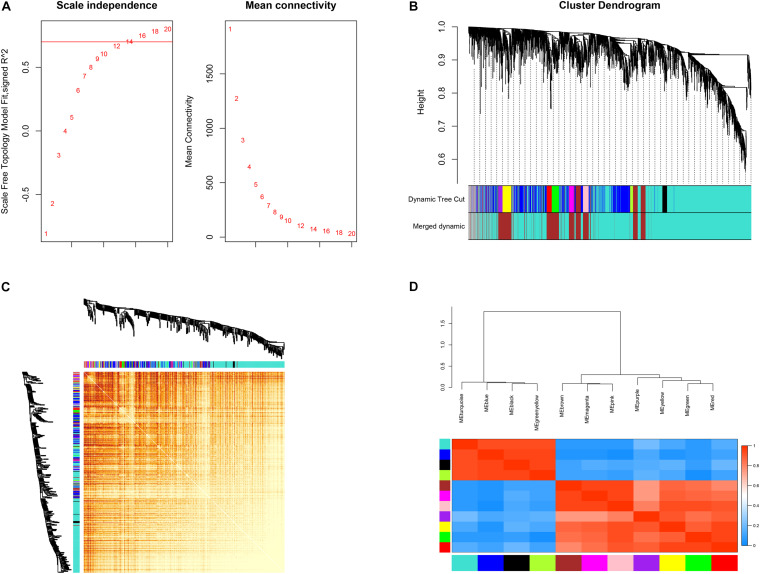
FIGURE 3.
Construction of co-expression modules. (A) Determination of soft-threshold power. (B) The cluster dendrogram of genes. Genes that could not be clustered into one of these modules were assigned to the gray module. Every gene represents a line in the hierarchical cluster. (C) Network heatmap plots of genes selected for weighted gene co-expression network analysis (WGCNA) construction. (D) Heatmap plot of the adjacencies in the eigengene network.

