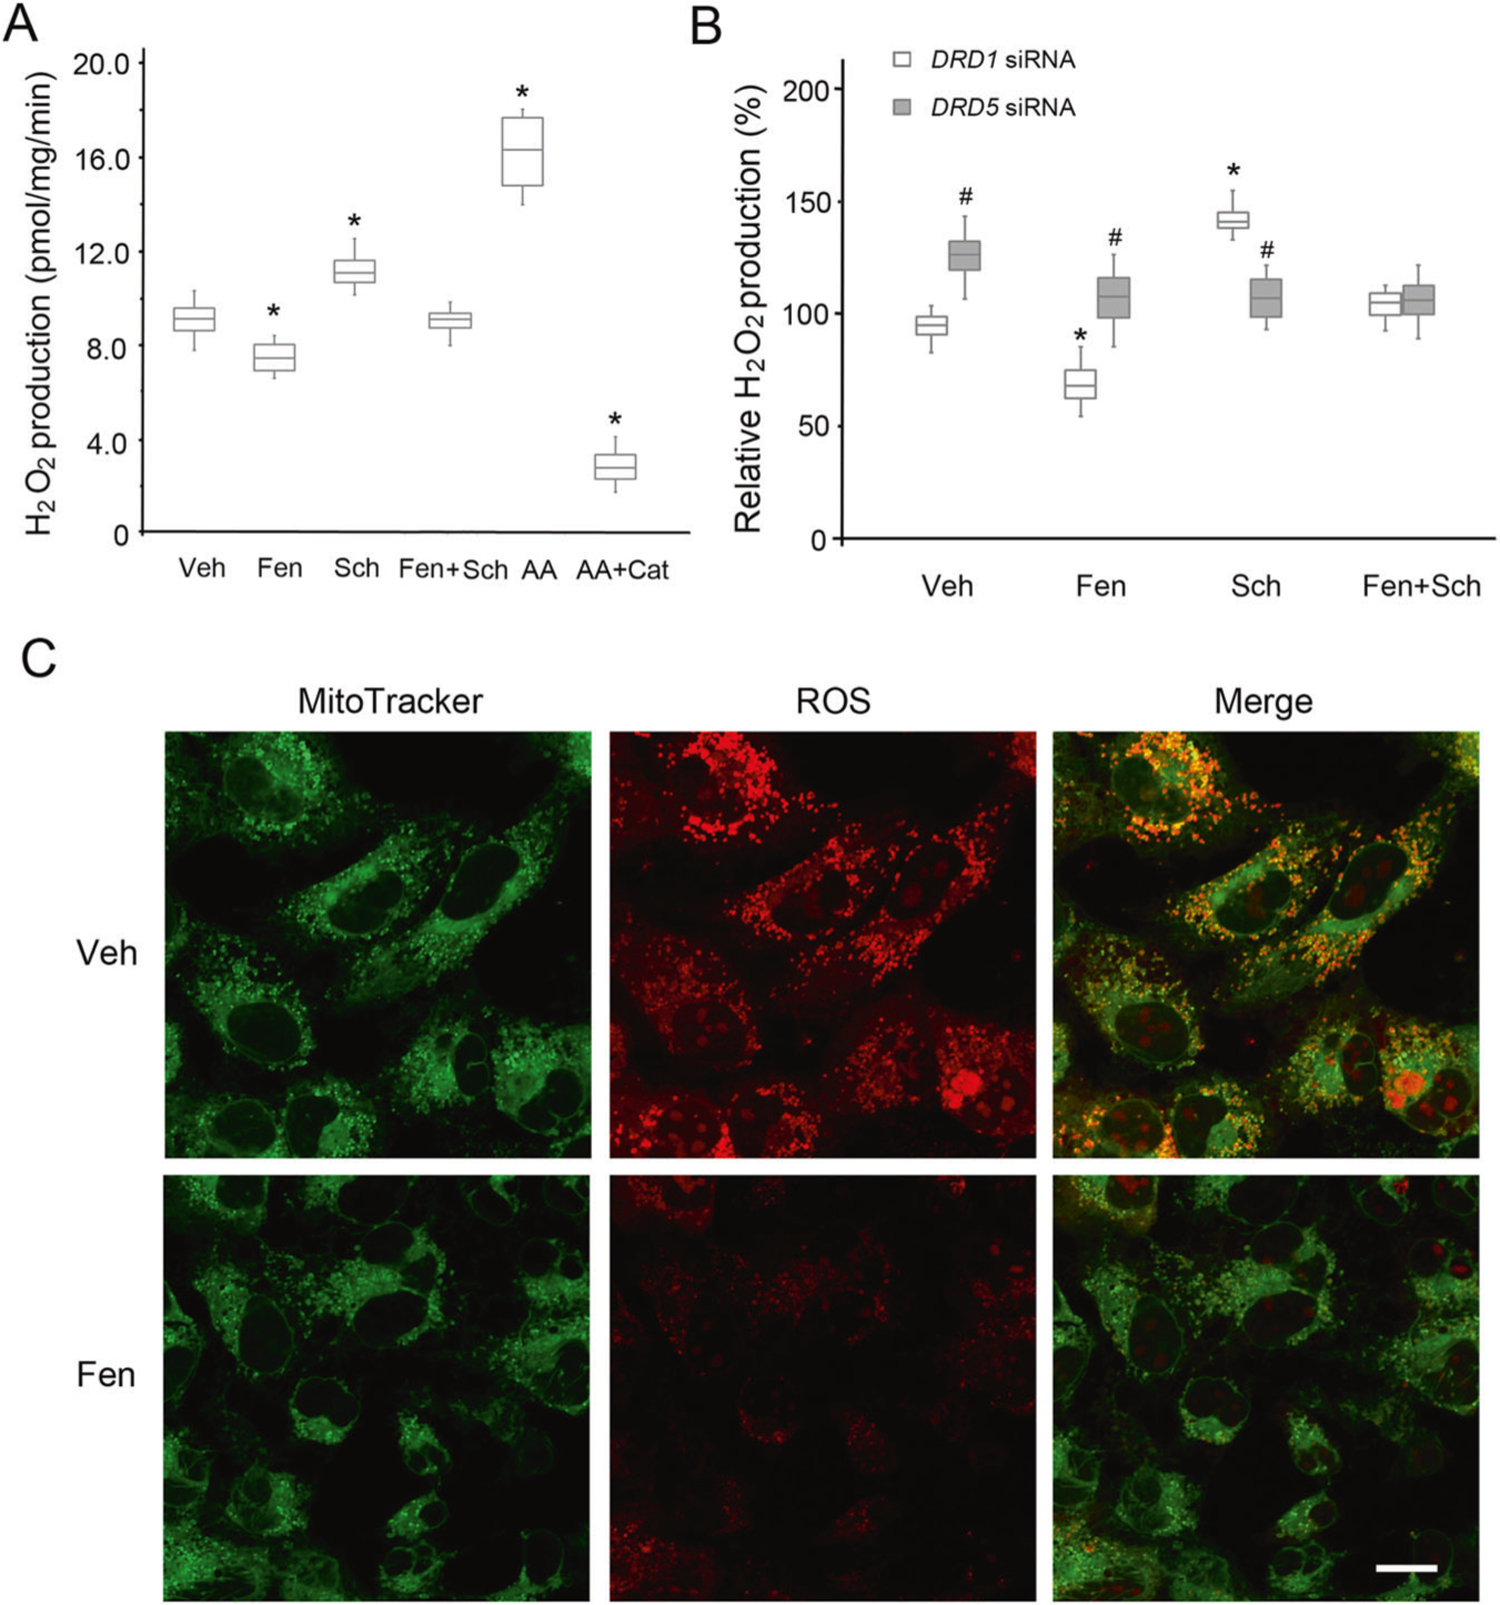
Fig. 3.

Mito-ROS production in human RPT cells. A H2O2 production from mitochondria isolated from human RPT cells, with pyruvate and malate as the substrates. Veh vehicle, Fen fenoldopam (D1R/D5R agonist, 1.0 μM, 12 h), Sch Sch23390 (D1R/D5R antagonist, 1.0 μM, 12 h), AA antimycin A (Qi site inhibitor of mitochondrial ETC Complex III, 0.75 μM, 2 h), Cat catalase (10 μM, 30 min prior to AA treatment). n = 4/group, *P < 0.05 vs Veh. B H2O2 production from mitochondria isolated from DRD1- or DRD5-silenced human RPT cells. The cells were treated with vehicle (Veh), Fen (1.0 μM, 12 h), or Sch (1.0 μM, 12 h). n = 4/group, *P < 0.05 vs Veh, #P < 0.05 vs DRD1-silenced RPT cells. C Mito-ROS staining in DRD1-silenced intact human RPT cells treated with Veh or Fen (1.0 μM, 12 h), as indicated. Bar, 10 μm. The images are from one of three independent experiments
