Figure 7.
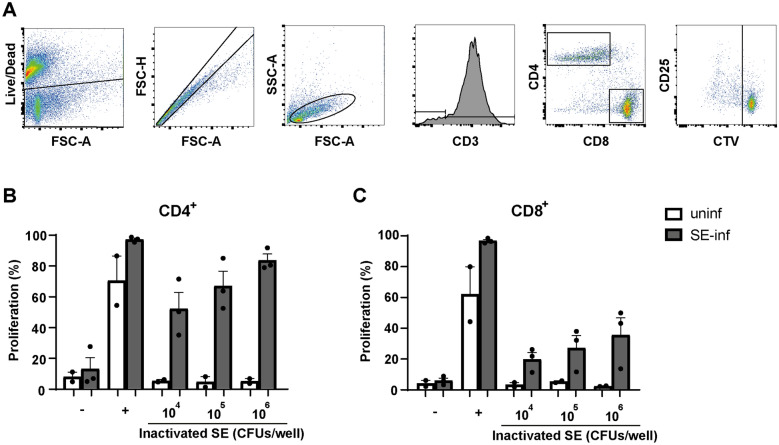
Ex vivo proliferation of SE-induced splenic CD4+ and CD8+ T cells.A The gating strategy shows the consecutive selection for viable cells (Live/Dead marker-negative), single cells (FSC-A vs FSC-H), lymphocytes (FSC-A vs SSC-A) and CD3+ T cells. T cells were subdivided into CD4+ and CD8+ T cells. The final gating step selects on T cell subsets which have divided at least once based on dilution of the cell proliferation dye CellTrace Violet (CTV). B The percentage of cells that have proliferated is shown for splenic CD4+ and C CD8+ T cells after 4 days of stimulation with different doses of formaldehyde-inactivated SE expressed in CFU/well, none stimulated controls (−), or after stimulation with anti-CD3, anti-CD28 and recombinant chicken IL-2 ( +). All splenocyte samples were stimulated and measured in triplicate for each of the conditions. Mean + SEM is shown; n = 2 for uninfected (uninf) and n = 3 for SE-infected (SE-inf) chickens.

