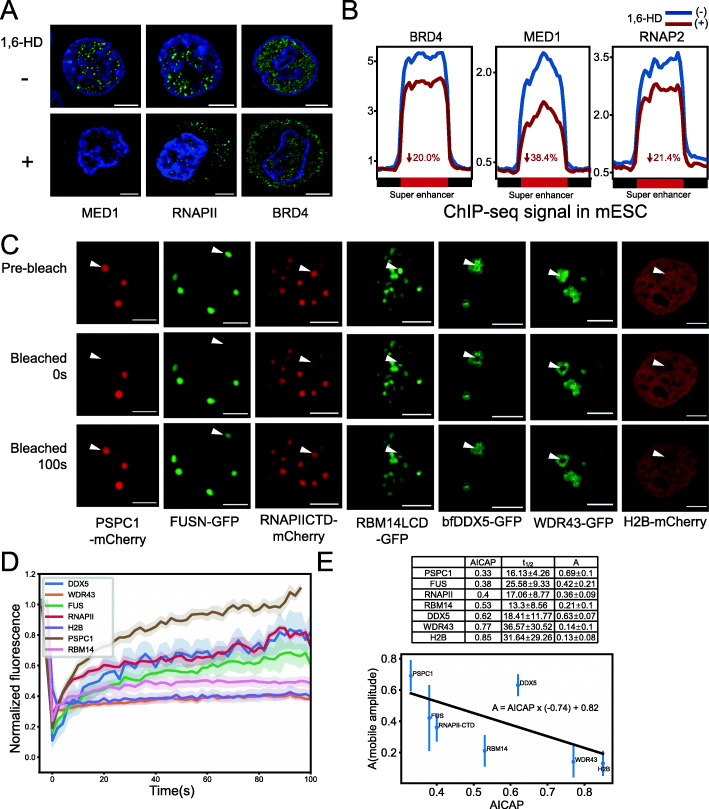
Fig. 4.
Experimental validation of AICAP. A Immunofluorescence of MED1, RNAPII, and BRD4 before (−) and after (+) 1,6-HD treatment. Scale bar indicates 5 μm. B ChIP-seq signal enrichment of BRD4, MED1, and RNAPII at regions defined as super enhancer in mESC before (1,6-HD−) and after (1,6-HD+) 1,6-HD treatment. The decreased percentage of signal is noted. Data resource [6]. C FRAP experiments on 7 proteins in HeLa cells. Scale bar indicates 5 μm. D FRAP curves of proteins in C. E Calculated parameters of FRAP experiments using chemical interaction model (top). The mobile fraction was fitted using linear regression (bottom)

