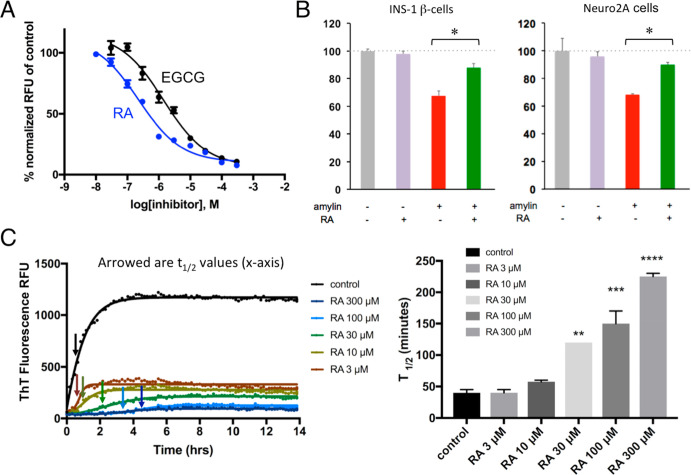
Figure 2.
Characterizations of RA as a strong amylin amyloid inhibitor. (A) Amylin–ThT fluorescence-based inhibition assay. RA is estimated to have an IC50 between 200 and 300 nM. IC50 curve for control EGCG is also shown (1 μM) as a comparison. (B) Neutralization of amylin-amyloid-induced cytotoxicity by RA in pancreatic INS-1 cells and neuronal Neuro2A cells. Amylin concentration was 3.75 μM, and the ratio of inhibitor/amylin was 5:1. RA significantly detoxified amylin-amyloid-induced cytotoxicity in both cell lines, as indicated by asterisks (p < 0.05). (C) RA-induced dose-dependent kinetic delays in amyloid formation. Left panel shows the measurements of t1/2 of amylin amyloid formation by amylin–ThT fluorescence based assays, as indicated by the arrows. Concentration of amylin was 10 μM. Time points for t1/2 are shown as arrowed. At least three repeats have been carried out. The right panel shows corresponding quantification and display in bar graph format of t1/2 values with each treatment. With increased concentration of RA treatment, t1/2 becomes significantly delayed (**, p < 0.05; ***, p < 0.01; ****, p < 0.001).

