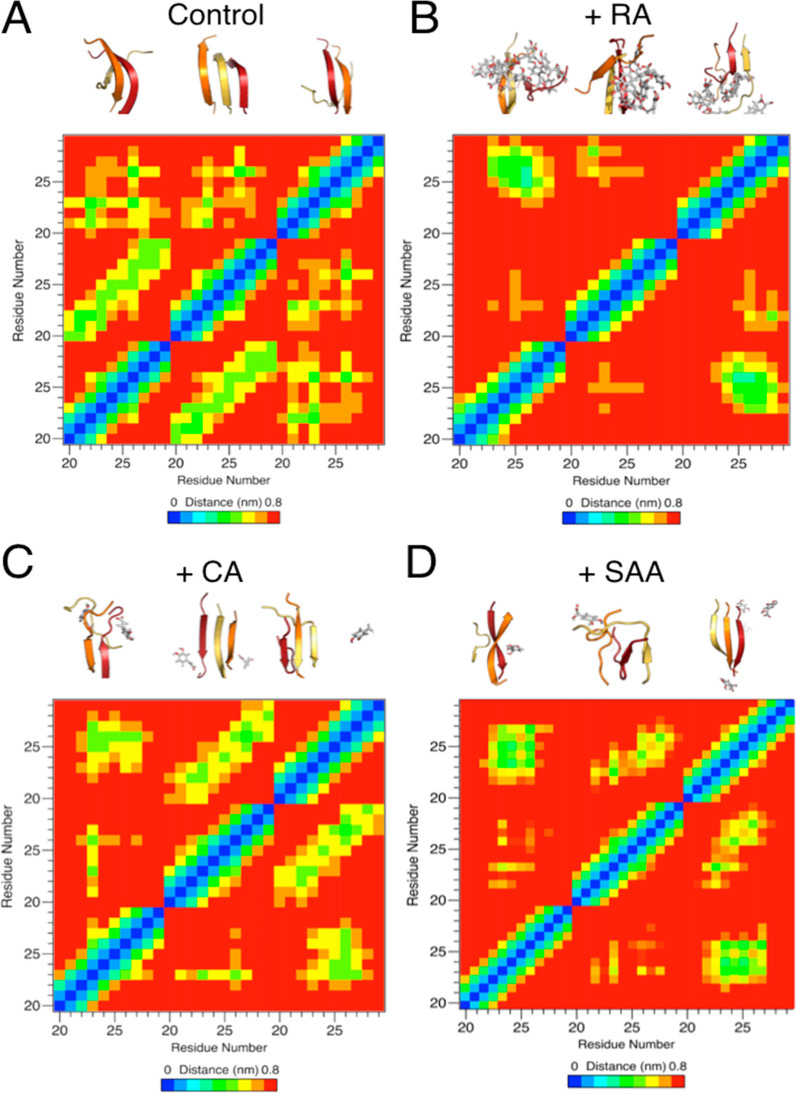
Figure 4.
Additive effects of RA components in amylin amyloid inhibition with MD simulation studies. Dominant morphologies of amylin20–29 trimer formation (A) with and without the presence of RA (B), CA (C), and SAA (D) shown in the upper portions of each panel. Individual amylin20–29 peptide fragments are shown in cartoon and colored red (peptide 1), orange (peptide 2), and yellow (peptide 3). RA, CA, and SAA are shown as gray sticks, colored by element. For the panels of CA (C) and SAA (D), only CA and SAA molecules within 1.0 nm of the amylin20–29 trimer are shown for clarity. Significantly less β-structure is observed in the presence of RA (B), and a reduction in β-structure is observed in the cases of CA (C) and SAA (D). Residue–residue interaction plots for corresponding drug treatment are shown as “heat” maps in the lower portions of each panel. x- and y-axis labels are in peptide fragment length (residues 20–29), with each repeating number (e.g., 20) being a separate peptide. Significantly less intermolecular interactions between amylin fragments is observed in the presence of RA in comparison with the control. Reduction in interactions is observed in the cases of CA and SAA treatment.

