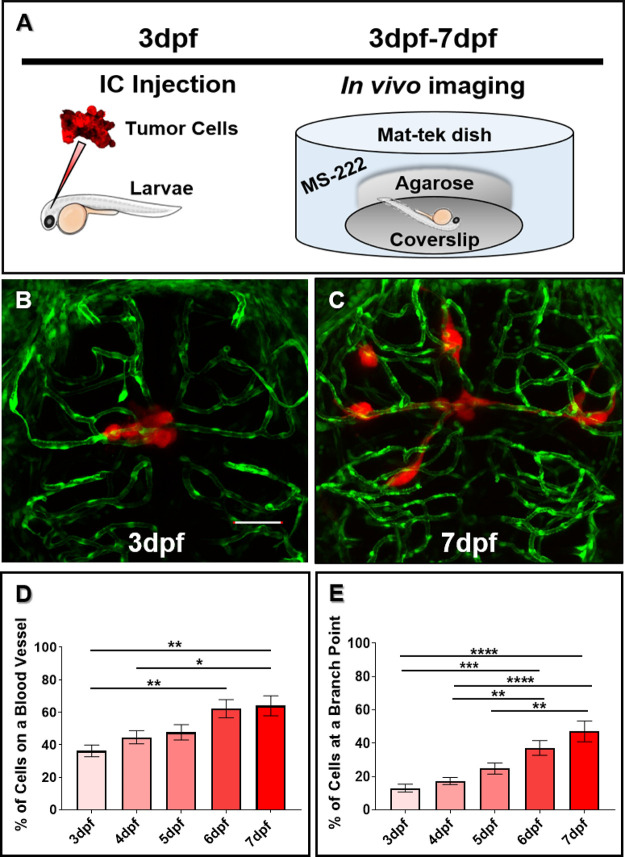
Figure 2.
Glioma cells actively associate with the developing zebrafish brain vasculature over time. (A) A cartoon schematic of intracranial (IC) injection and subsequent in vivo imaging of our zebrafish perivascular glioma model. Tg(fli1a:eGFP)y1;casper animals were injected with 25–50 glioma cells in the midbrain-hindbrain boundary at 3dpf. After recovering, animals were imaged every day until 7dpf to monitor tumor burden over time. (B,C) Representative maximum intensity projection confocal images of tumor cells implanted at 3dpf (B) and subsequent migration by 7dpf (C). Scale bar = 50 μm. (D,E) Quantification of tumor-vessel interactions in the developing brain. (D) Quantification of D54-MG-tdTomato cells attached to blood vessels over time (**p < 0.001, *p = <0.05). (E) Quantification of D54-MG-tdTomato cells at vessel branch points over time (****p = <0.0001, ***p = <0.001, **p = <0.01). n = 18–21 animals per time point. A one-way ANOVA with Tukey’s multiple comparisons test was performed. Error bars represent mean with standard error of the mean.

