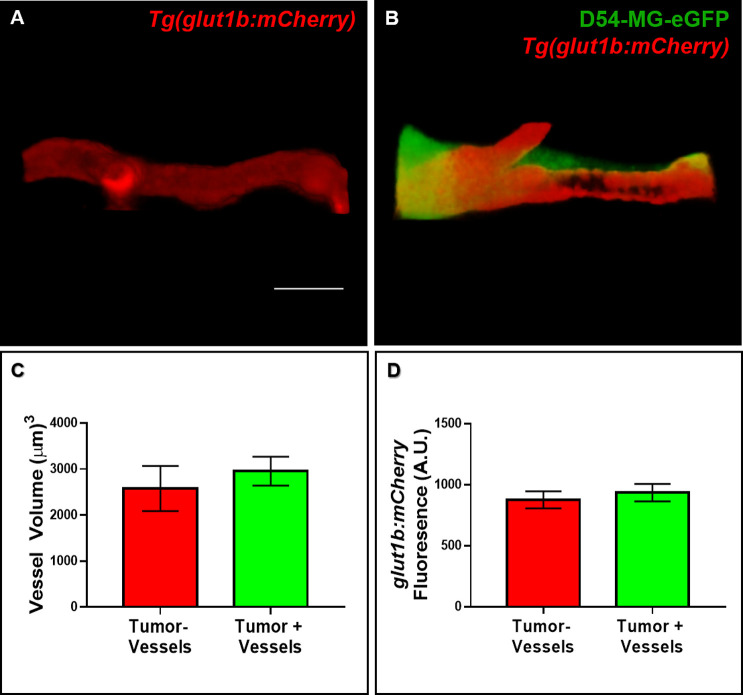
Figure 5.
Vessel volume and glut1 expression are not altered after acute GBM invasion. (A,B) Representative 3D rendered volume views of a blood vessel from the contralateral brain (A) in a region similar to a vessel co-opted by a D54-MG-eGFP tumor cell in a 7dpf zebrafish brain (B). (C,D) The volume and signal intensity of glut1 in tumor-associated and nontumor associated vessels were measured in 3D rendered volume views. (C) Quantification of vessel volume. A two-tailed, paired Student’s t test was performed. (D) Quantification of glut1b:mCherry fluorescence. A two-tailed, paired Student’s t test was performed. Error bars represent mean with standard error of the mean. n = 8 animals total, 1–3 vessels per animal per group. Scale bar = 10 μm.

