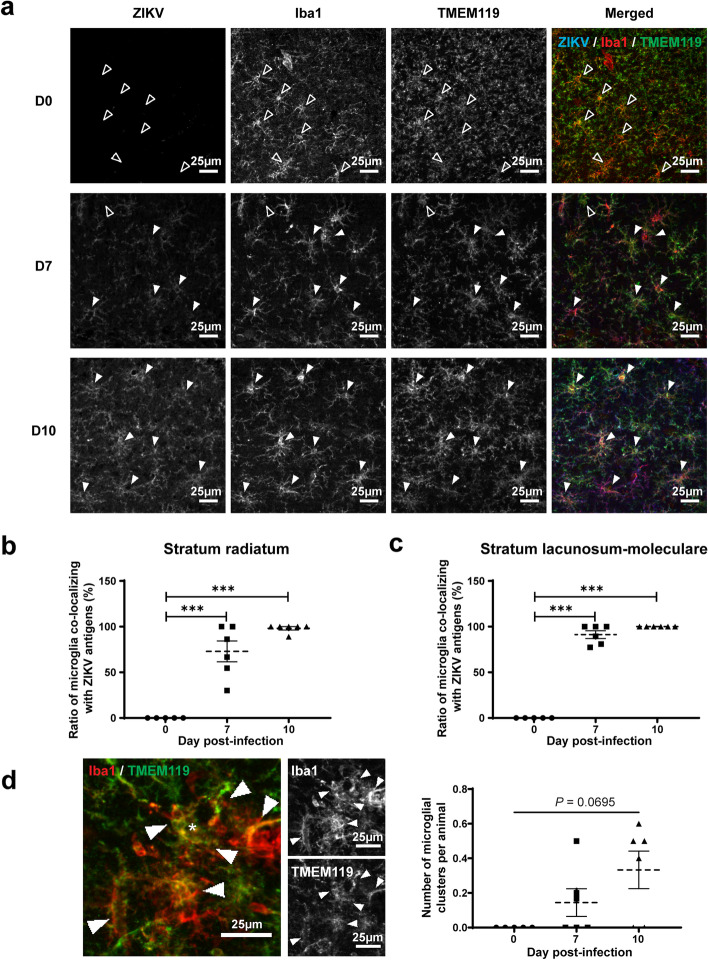
Fig. 3.
Co-localization of Iba1+/TMEM119+ microglia and ZIKV antigens in the dorsal hippocampus CA1. a Representative micrographs illustrating the localization of ZIKV antigens and Iba1+/TMEM119+ microglial cells after immunofluorescence labeling in the st rad on days 0 (noninfected), 7, and 10 post-infection. Filled and open arrowheads show microglia co-localizing with ZIKV or not, respectively. Scale bars on the picture are equivalent to 25 µm. b–c Percentage of Iba1+/TMEM119+ microglia co-localizing with ZIKV antigens in the st rad (b) and the st lac mol (c). d Representative micrographs showing a microglial cluster (indicated by an *) and number of microglial clusters per animal during ZIKV infection. Results are the mean ± SEM of 5–6 hippocampi per animal, for a total of 5–6 mice per time point. Statistical analysis was performed using a one-way ANOVA with Tukey’s multiple comparison test. Results that are statistically different between indicated groups are shown as follows: *** P < 0.001

