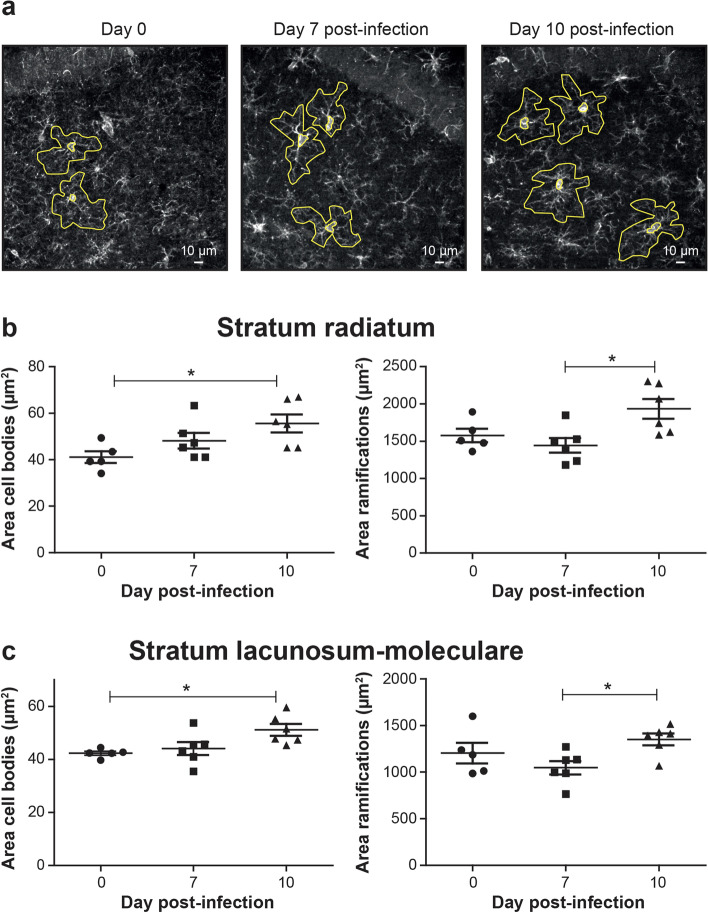
Fig. 4.
Morphology of Iba1+/TMEM119+ microglial cells in the dorsal hippocampus CA1 after ZIKV challenge. a Representative micrographs with examples of tracing around Iba1+/TMEM119+ microglia (using the Iba1+ channel) in the st rad on day 0 (noninfected), 7, and 10 post-infection that were used to calculate the areas of cell bodies and arborizations. Scale bars on the picture are equivalent to 10 µm. b–c Areas of cell bodies (left) and areas of ramifications (right) of Iba1+/TMEM119+ microglia in the st rad (b) and st lac mol (c). Results are the mean ± SEM of 17 to 21 microglial cells per animal for a total of 5–6 mice per time point. Statistical analysis was performed using a one-way ANOVA with Tukey’s multiple comparison test. Statistically different results between indicated groups are presented as follows: * P < 0.05

