Fig. 5.
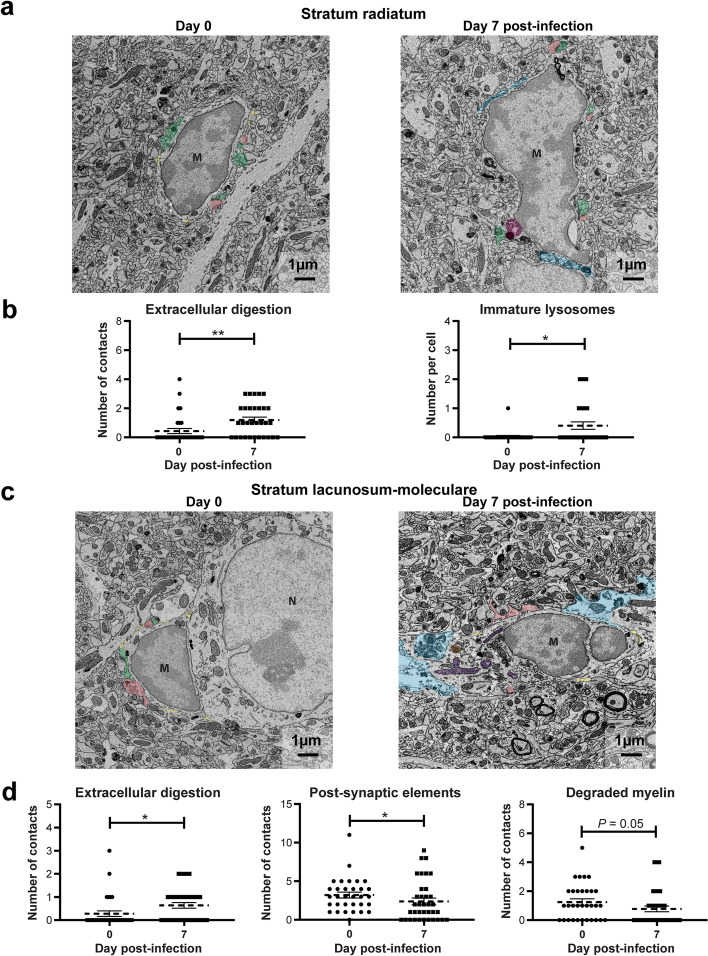
Ultrastructural analysis of the dorsal hippocampus CA1 of mice infected with ZIKV. a Example pictures of microglia in the stratum radiatum of noninfected (day 0) and infected mice (day 7 post-infection) highlighting changes in b extracellular digestion and the number of immature lysosomes per cell during ZIKV infection. Results are the mean ± SEM of 32–33 microglia per time point (6–10 microglia per animal for a total of 4 mice per time point). c Example pictures of microglia in the stratum lacunosum-moleculare of noninfected (day 0) and infected mice (day 7 post-infection) showing changes of d extracellular digestion and contacts with postsynaptic elements and degraded myelin per cell during ZIKV infection. Results are the mean ± SEM of 32–36 microglia per time point (7–10 microglia per animal for a total of 4 mice per time point). On the example pictures, cell types are identified by a capital letter; M, microglia; N, neuron. Structural elements on the example pictures are identified by a mix of pseudo-coloring and text annotation; presynaptic elements (green), postsynaptic elements (red), extracellular space (yellow), extracellular digestion (light blue), immature lysosomes (pink), mature lysosomes (orange), abnormal mitochondria (purple), and dilated endoplasmic reticulum (white asterisk). Scale bars on the picture are equivalent to 1 µm. Statistical analyses were performed using a nonparametric Mann–Whitney comparison test. Results that are statistically different between indicated groups are shown as follows: * P < 0.05; ** P < 0.01

