
Figure 1.
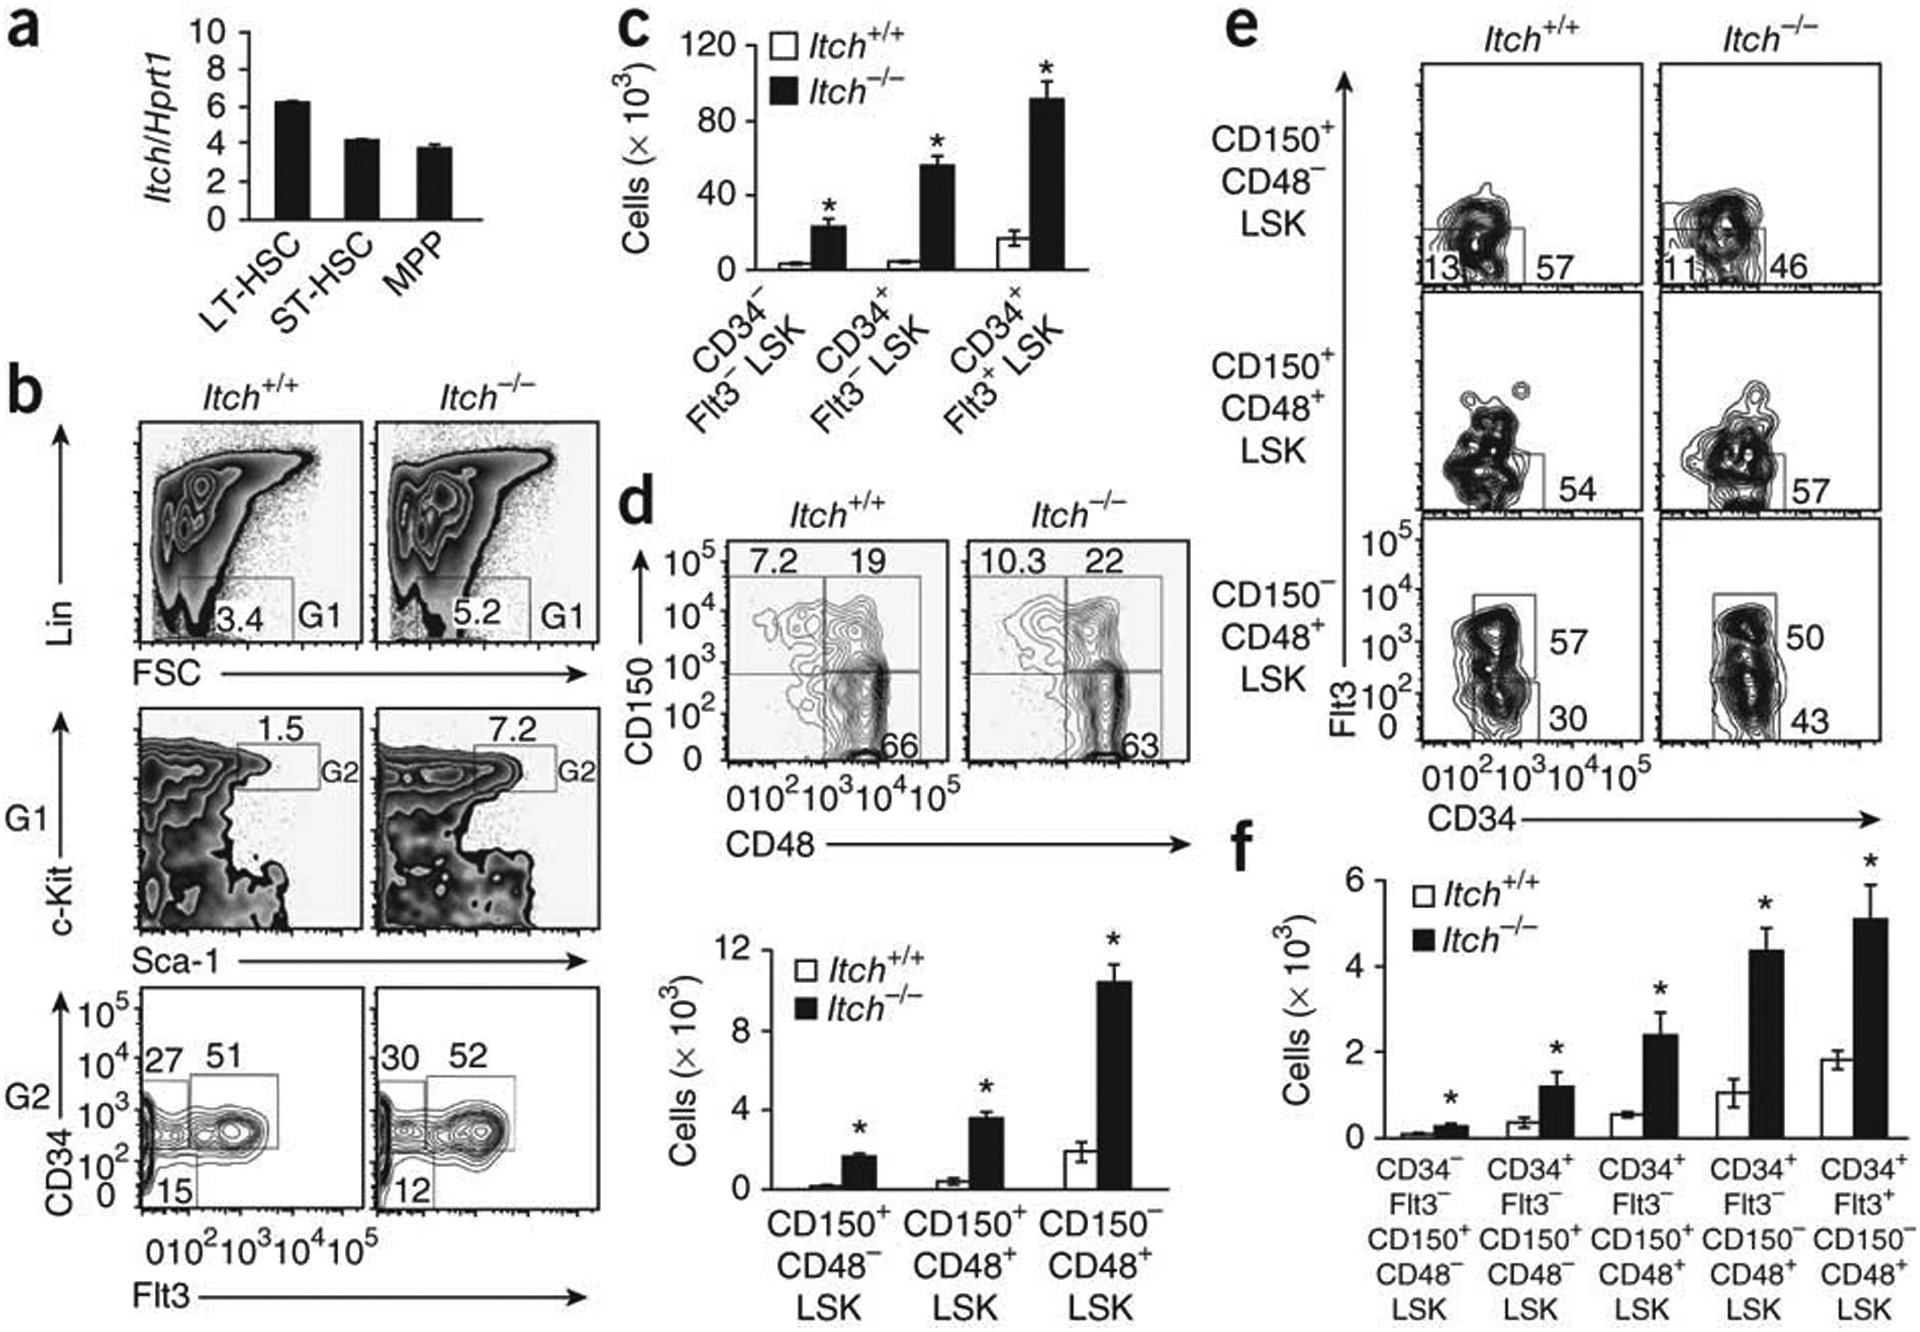
Itch deficiency results in a greater frequency of HSCs in the bone marrow. (a) Real-time PCR analysis of Itch mRNA expression in sorted LT-HSCs (LSK CD150+CD48−), ST-HSCs (LSK CD150+CD48+) and MPPs (LSK CD150−CD48+), presented relative to the expression of Hprt1 (encoding hypoxanthine guanine phosphoribosyl transferase). (b) Distribution of Lin− cells (top), LSK cells (middle) and LSK subsets defined on the basis of the expression of CD34 and Flt3 (bottom), among total wild-type and Itch−/− bone marrow cells. Numbers adjacent to outlined areas indicate percent cells in each throughout. (c) Absolute number of cells in HSC subsets in 4-week-old wild-type and Itch−/− mice (n = 5 per group) based on the gates presented in b. (d) Distribution (top) and absolute number (bottom) of LSK subsets in 4-week-old wild-type and Itch−/− mice (n = 5 per group), assessed on the basis of expression of CD150 and CD48. (e) Expression of Flt3 and CD34 on cells of wild-type and Itch−/− bone marrow LSK subsets identified as in d. (f) Absolute number of cells of LSK subsets from 4-week-old wild-type and Itch−/− mice (n = 5 per group), stained as in e. *P < 0.05 (Student’s t-test). Data are representative of two independent experiments (a; mean and s.e.m. of duplicates) or ten (b–e) or three (f) independent experiments (mean and s.e.m. in c,d,f).