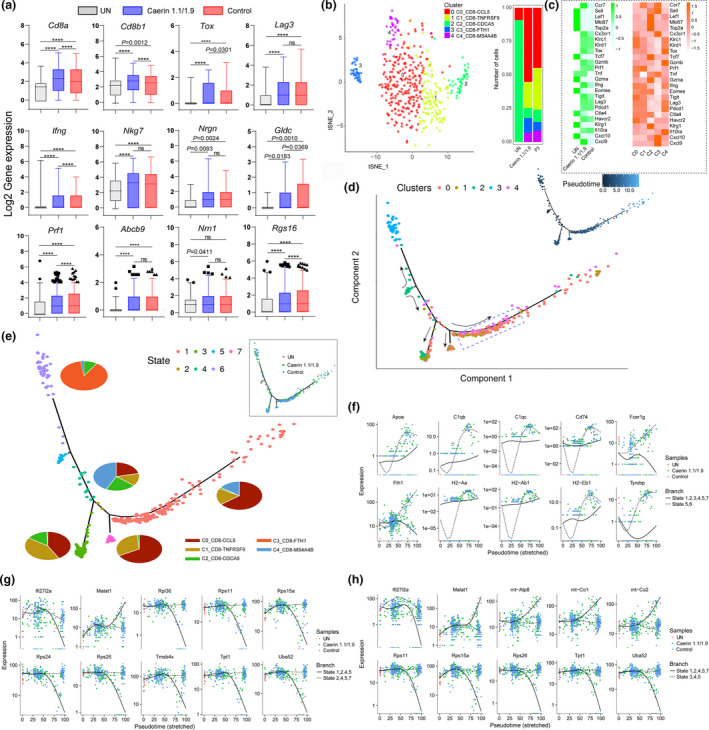
Figure 6.

Comparison of CD8+ T‐cell marker genes with two treatments and state transition analysis based on integrated expression in subpopulations. (a) The expressions (log2 value) of Cd8a, Cd8b1, Tox, Lag3, Ifng, Nkg7, Nrgn, Gldc, Prf1, Abcb9, Nrn1 and Rgs16 in untreated tumors, treatments containing caerin 1.1/1.9 or control. (b) The analysis of subpopulations of CD8+ T cells and the number of cells under the aforementioned three conditions. (c) The heatmaps compared the average expressions of selected genes in the untreated and treated tumors, and in five subpopulations. (d) The ordering of CD8+ T‐cell subpopulations along pseudotime in a two‐dimensional state space is defined by Monocle3. Cell orders are inferred from the expression of most dispersed genes across CD8+ T‐cell subpopulations. Each point corresponds to a single cell, and each colour represents a T‐cell subpopulation. Cells on the same or neighbouring branches are expected to be more hierarchically related. (e) Developmental states of CD8+ T cells inferred by pseudotime. The space distribution of cells is defined in (b). Each colour represents a distinct state on the trajectory generated by Monocle. Pie charts show the proportion of cell clusters at the state when multiple clusters are involved. The top 10 genes differentially expressed in different states on branches 1 (f), 2 (g) and 3 (h) along with stretched pseudotime with respect to different treatments.
