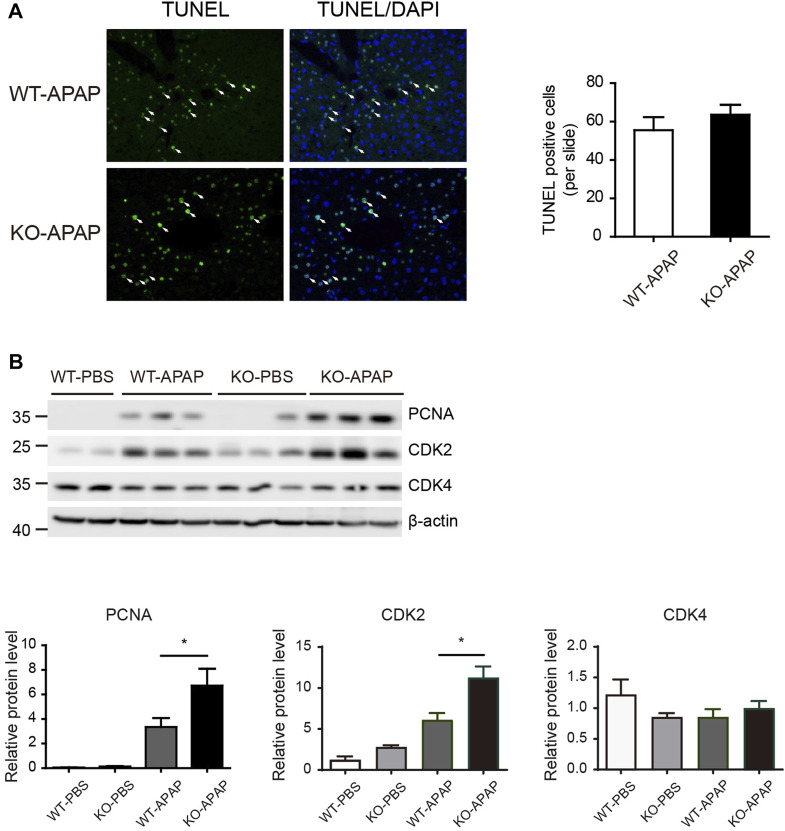
FIGURE 3.
Increased proliferation in APAP-treated ZnT8 KO livers. (A) Representative TUNEL staining images and quantification of TUNEL-positive cells. (B) Immunoblotting and quantification of PCNA, CDK2, and CDK4 in liver. β-tubulin was used as an internal control. Data are expressed as mean ± SEM. *, p < 0.05 by the one-way ANOVA test or unpaired Student’s t-test. NS, not significant.

