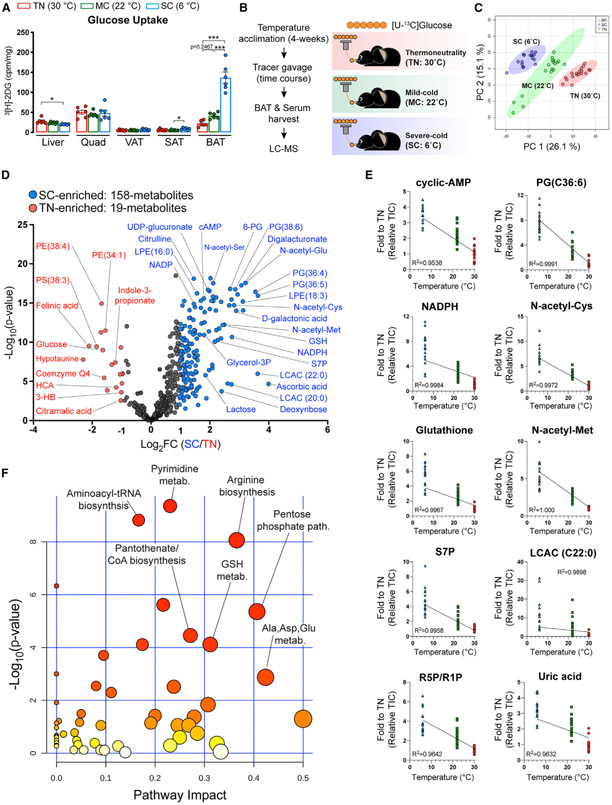
Figure 1. Severe cold (SC) profoundly remodels BAT’s metabolic landscape.
(A) Uptake of orally delivered 3H-2-deoxy-glucose (3H-2DG) by the indicated organs in mice acclimated to thermoneutrality (TN; red, 30°C), mild cold (MC; green, 22°C), and SC (blue, 6°C) for 4 weeks (n = 6). For subcutaneous adipose tissue (SAT) and visceral adipose tissue (VAT), inguinal WAT and perigonadal WAT were collected, respectively.
(B) Experimental strategy for in vivo isotope tracing and metabolomics of BAT in mice adapted to different temperatures. Mice were acclimated to TN, MC, and SC for 4 weeks. Then, mice received [U-13C]-glucose tracer via oral gavage. Metabolite levels, labeling in serum, and BAT were measured at multiple time points after gavage by LC-MS (n = 5–7 per time point).
(C) Principal-component analysis (PCA) of BAT metabolome in mice adapted to TN, MC, and SC (n = 17–20).
(D) Volcano plot of BAT metabolome in mice adapted to TN versus SC. The colored dots (blue or red) indicate significantly enriched metabolites at each group (1 ≥ Log2 fold changes compared with counterpart, p < 0.05 after false discovery rate [FDR] correction) (n = 17–20).
(E) Metabolites showing a linear relationship between temperatures and fold change of pool size normalized to TN.
(F) Metabolic pathway analysis of BAT metabolome in mice adapted to TN versus SC. The top pathways are ranked by the adjusted p values for permutation per pathway (y axis) and the total number of hits per pathway (x axis). The color graduated from white to yellow, orange, and red; circle size (from small to large) and the increase in values of both x and y represent the degree of significance.
TIC, total ion count.

