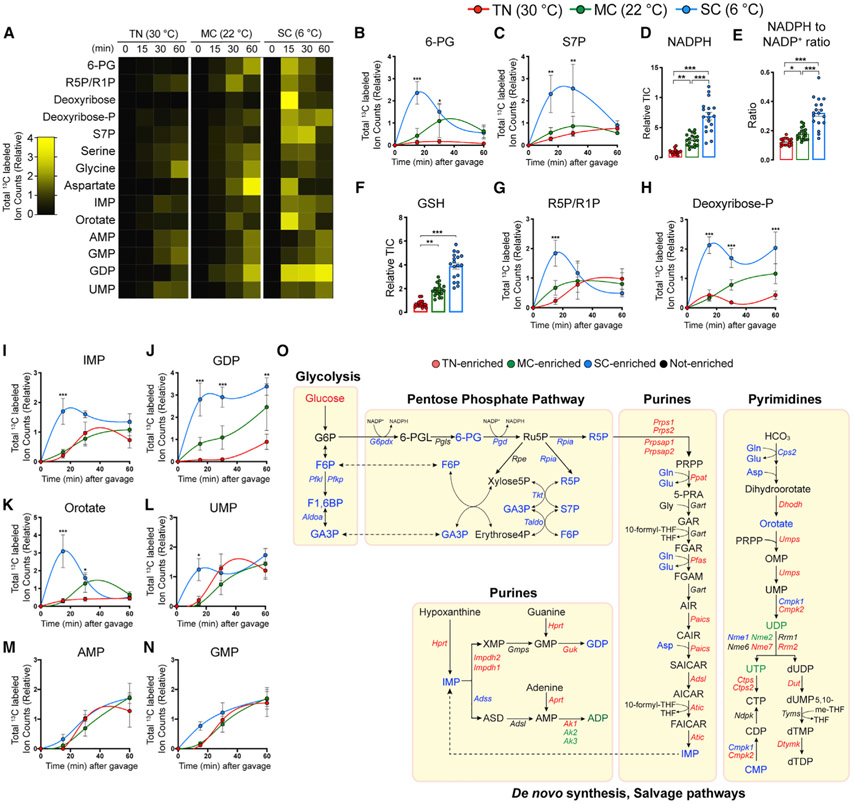
Figure 3. SC triggers BAT glucose flux into the pentose phosphate pathway that contributes to antioxidant and nucleotide synthesis.
(A) Heatmap showing relative total labeled carbons in the BAT metabolic intermediates in the pentose-phosphate pathway, nucleotides, and key amino acids in nucleotide biosynthesis from mice acclimated to TN (30°C), MC (22°C), and SC (6°C) for 4 weeks followed by fed [U-13C]-glucose via oral gavage (n = 5–7).
(B and C) Total labeled carbons in the pentose phosphate pathway intermediates of BAT (TN: red, 30°C; MC: green, 22°C; SC: blue, 6°C; n = 5–7).
(D) Relative abundance of total NADPH of BAT (n = 17–20).
(E) Relative abundance of NADPH over NADP+ of BAT (n = 17–20).
(F) Relative abundance of total glutathione (GSH) of BAT (n = 17–20).
(G and H) Total labeled carbons in the ribose phosphate species of BAT (n = 5–7).
(I–N) Total labeled carbons in the purine/pyrimidine biosynthesis intermediates of BAT (n = 5–7).
(O) Branch pathways of glycolysis, including pentose phosphate pathway and nucleotide, glycogen, and hexosamine biosynthesis and nucleotide-sugar pathways.
Data are mean ± SEM. Statistical significance was calculated using two-way ANOVA with Tukey’s multiple comparison test: *,#p < 0.05; **,##p < 0.01; ***,###p < 0.001 (TN versus SC, TN versus MC).

