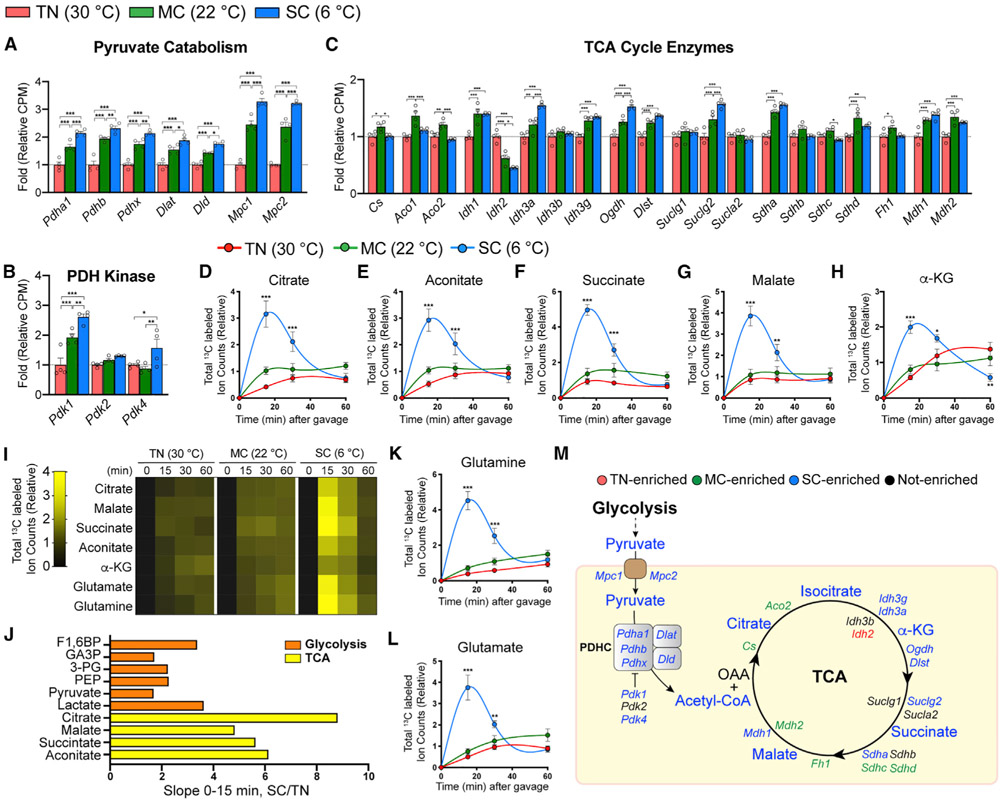
Figure 4. SC, but not MC, increases glucose flux into the TCA cycle.
(A–C) Relative gene levels of pyruvate catabolism and transporters, PDH kinases, and TCA cycle enzymes in BAT from mice acclimated to TN (red, 30°C), MC (green, 22°C), or SC (blue, 6°C) for 4 weeks, measured by RNA sequencing (n = 4).
(D–H) Total labeled carbons in the TCA intermediates of BAT from mice acclimated to TN, MC, and SC for 4 weeks, followed by [U-13C]-glucose provision via oral gavage (n = 5–7).
(I) Heatmap showing relative total labeled carbons in the TCA intermediates of BAT (n = 5–7).
(J) Bar graph showing each metabolite’s relative slope(0-15 min) of SC over TN.
(K and L) Total labeled carbons in glutamine (K) and glutamate (L) of BAT (n = 5–7).
(M) TCA cycle map. Colors indicate a temperature group showing significantly higher labeling or transcript abundance than other groups.
Data are mean ± SEM. Statistical significance was calculated using two-way ANOVA with Tukey’s multiple comparison test: *,#p < 0.05; **,##p < 0.01; ***,###p < 0.001 (TN versus SC, TN versus MC).

