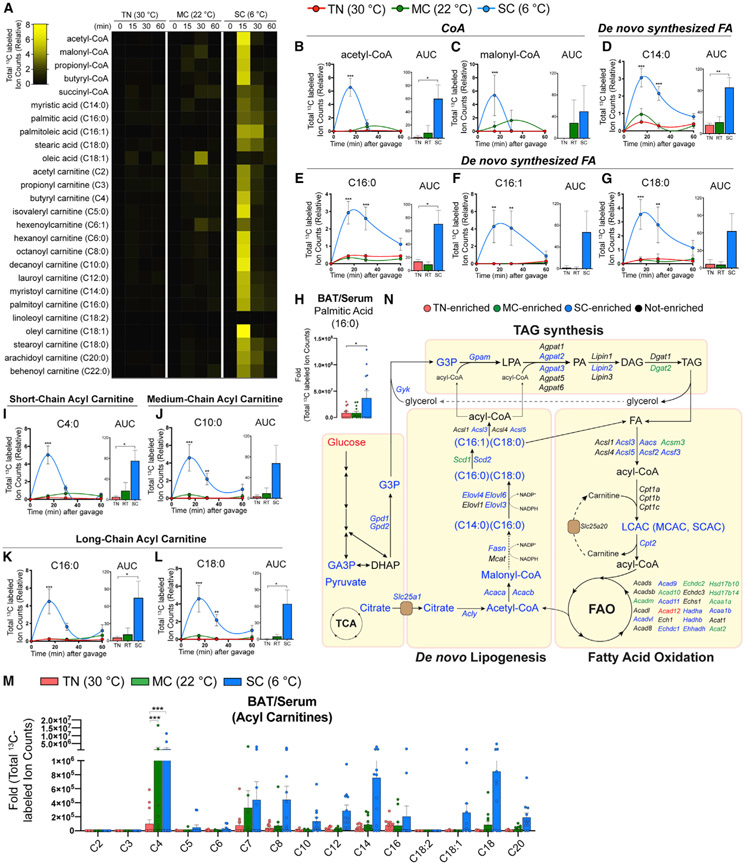
Figure 5. BAT glucose usage for fatty acid synthesis and oxidation is accelerated by SC, but not by MC.
(A) Heatmap showing relative total labeled carbons of fatty acids and their precursors and acyl-carnitine species in BAT from mice acclimated to TN (30°C), MC (22°C), and SC (6°C) for 4 weeks, followed by [U-13C]-glucose provision via oral gavage (n = 5–7).
(B and C) Total labeled carbons in the CoA species of BAT and their area under curve (AUC0–60 min) (TN: red, 30°C; MC: green, 22°C; SC: blue, 6°C; n = 5–7).
(D–G) Total labeled carbons in the fatty acids of BAT and their AUC0–60 min (n = 5–7).
(H) Relative total labeled carbons in palmitic acid of BAT over serum (n = 12–13).
(I–L) Total labeled carbons in the acyl carnitines of BAT and their AUC0–60 min (n = 5–7).
(M) Relative total labeled carbons in the acyl carnitine species of BAT over serum (n = 12–13).
(N) Pathway map of de novo lipogenesis, triacylglycerol (TAG) synthesis, and fatty acid oxidation. Colors indicate a temperature group showing significantly higher labeling or transcript abundance than other groups.
Data are mean ± SEM. Statistical significance was calculated using two-way ANOVA with Tukey’s multiple comparison test: *,#p < 0.05; **,##p < 0.01; ***,###p < 0.001 (TN versus SC, TN versus MC).

