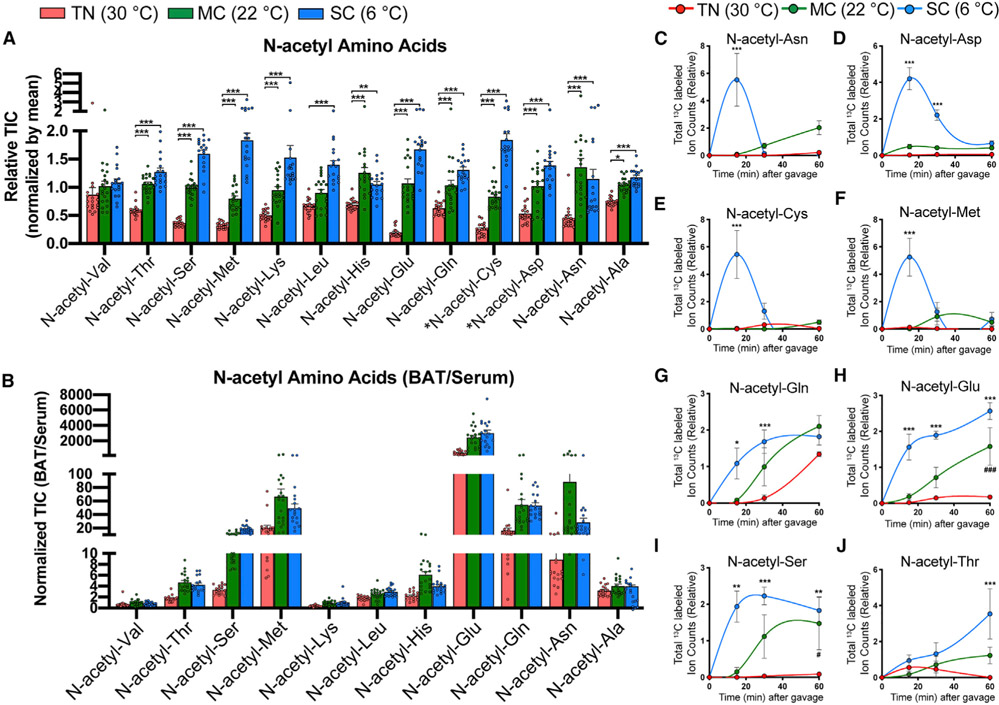
Figure 6. N-acetyl-amino acids are highly enriched and produced in BAT upon cold.
(A) Relative abundance of N-acetyl-amino acids in BAT from mice acclimated to TN (red, 30°C), MC (green, 22°C), and SC (blue, 6°C) for 4 weeks, followed by [U-13C]-glucose provision via oral gavage (n = 17–20). *Note that N-acetyl-cysteine (N-acetyl-Cys) and N-acetyl-aspartate (N-acetyl-Asp) were detected only within BAT, but not in serum.
(B) Relative abundance of N-acetyl-amino acids in BAT over serum (n = 17–20).
(C–J) Total labeled carbons in the N-acetyl-amino acids of BAT (n = 5–7).
Data are mean ± SEM. Statistical significance was calculated using two-way ANOVA with Tukey’s multiple comparison test: *,#p < 0.05; **,##p < 0.01; ***,###p < 0.001 (TN versus SC, TN versus MC).

