Fig. 2.

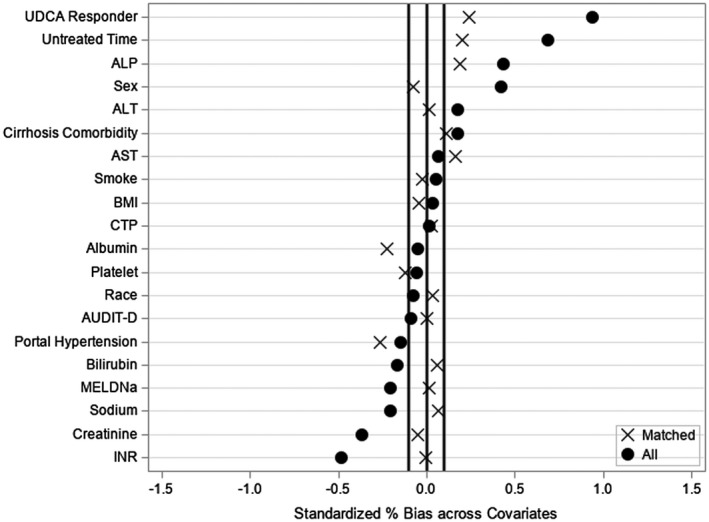
Standardized variable differences plot between subjects exposed to OCA and controls with PBC cirrhosis, before (o) and after (x) PS matching.

Standardized variable differences plot between subjects exposed to OCA and controls with PBC cirrhosis, before (o) and after (x) PS matching.