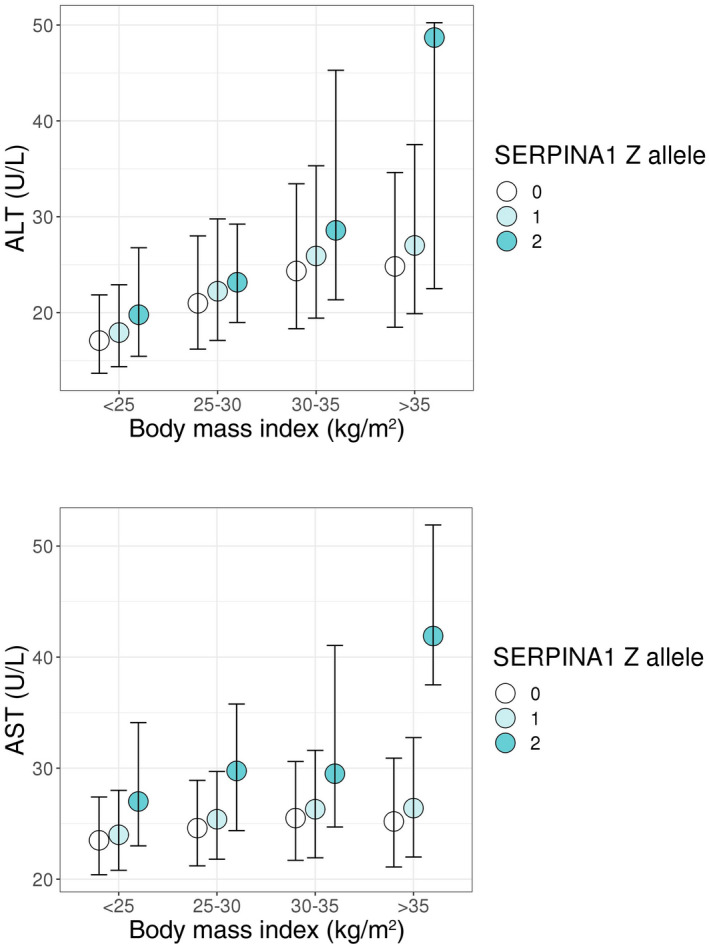
FIG. 4.

ALT and AST by BMI and SERPINA1 genotype in UK Biobank. Circles and bars depict medians and interquartile ranges, respectively. The ALT‐ and AST‐increasing effect of the SERPINA1 Z allele was amplified by increasing BMI (P for interaction SERPINA1 Z allele × BMI on ALT = 0.021; P for interaction SERPINA1 Z allele × BMI on AST = 0.0040). Significant interaction was also observed in a sensitivity analyses excluding Z allele homozygotes (P interaction = 0.026 for ALT; P interaction = 0.0088 for AST).
