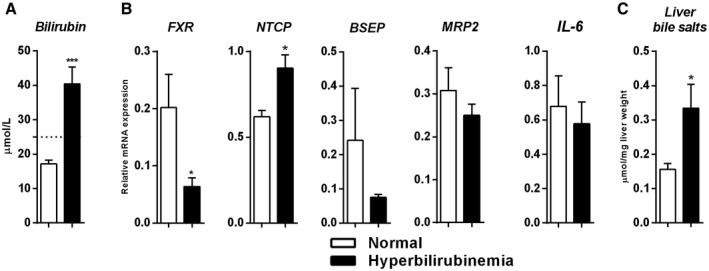
FIG. 4.

Alteration of bile salt homeostasis shortly after liver resection precedes postoperative hyperbilirubinemia. (A) Bilirubin levels (n = 10 vs. n = 14) on POD1. (B) Gene expression immediately after resection (n = 7 vs. n = 8) of FXR, FXR‐regulated genes engaged in bile salt transport, and IL‐6 between controls and hyperbilirubinemic patients. (C) Hepatic bile salt content (n = 6 vs. n = 7) immediately after resection. Bars represent means and SEMs. White bars indicate healthy patients and black bars indicate hyperbilirubinemic patients. The interrupted line in (A) reflects bilirubin levels ≥ 1.5 times ULN. The significance level is depicted by asterisks and denotes significant differences between the normal and cholestasis groups: *P < 0.05.
