Figure 2.
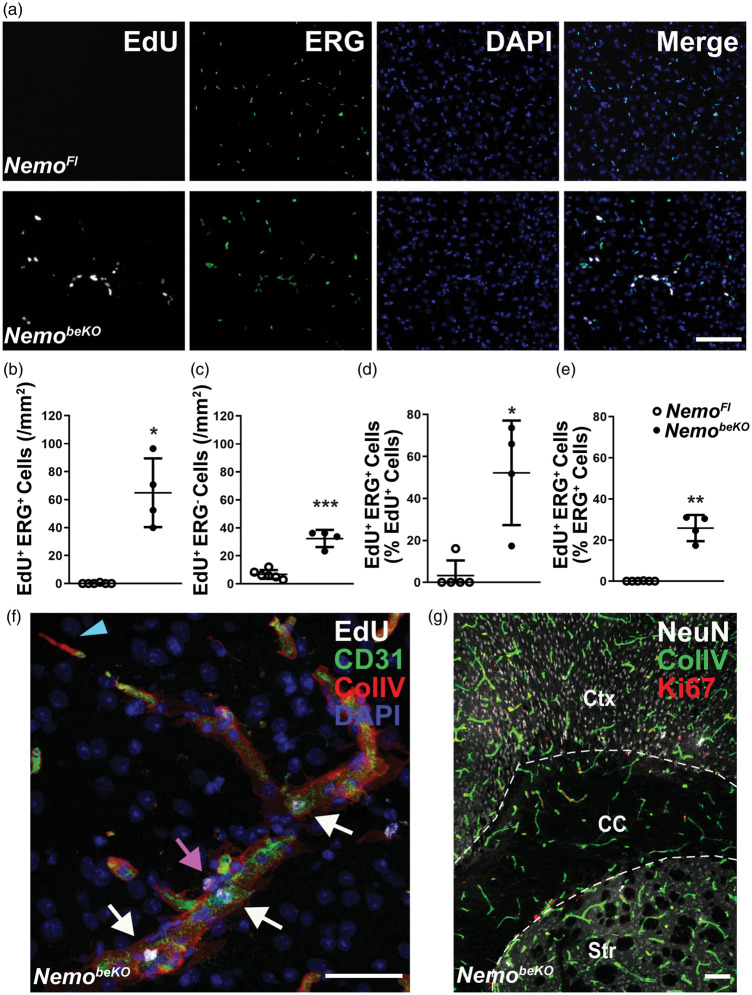
A large proportion of cerebral ECs in NemobeKO mice perform DNA synthesis. (a) Representative stainings for EdU and ERG revealed an increase in proliferation of ECs and non-ECs in the cortex of NemobeKO but not NemoFl mice that received EdU at day 10, day 12, and day 15 and were killed on day 16 after starting tamoxifen injections. EdU incorporation is used as a marker of DNA synthesis and nuclei were stained with DAPI. Scale bar, 100 μm. (b)–(e) Quantification of proliferating ERG+ ECs (b), (d), (e) and ERG− non-ECs (c) in the cortex of NemobeKO and NemoFl mice (n = 4–6). The number of proliferating ECs (EdU+ERG+) is expressed as percentage of the total number of proliferating EdU+ cells (d) or as percentage of the total number of ERG+ ECs (e). Data are shown as means ± SD, *P <0.05, **P <0.01, ***P < 0.001, determined by two-tailed unpaired t-test with (b), (d) and (e), or without (c) Welch’s correction. (f) Representative image stained for EdU, collagen IV (ColIV) and CD31, in high magnification showing a microvessel undergoing proliferation in the cortex of a NemobeKO mouse. Proliferating ECs (EdU+CD31+, white arrows) and non-ECs (EdU+CD31−, magenta arrow), and a string vessel (ColIV+CD31− string-like structure, blue arrowhead) are shown in this image. Scale bar, 50 μm. (g) Representative staining for NeuN, ColIV and Ki67 showing proliferating cells along the vessels in different regions of the brain. Ctx: cortex; CC: corpus callosum; Str: striatum. Scale bar, 100 μm.

