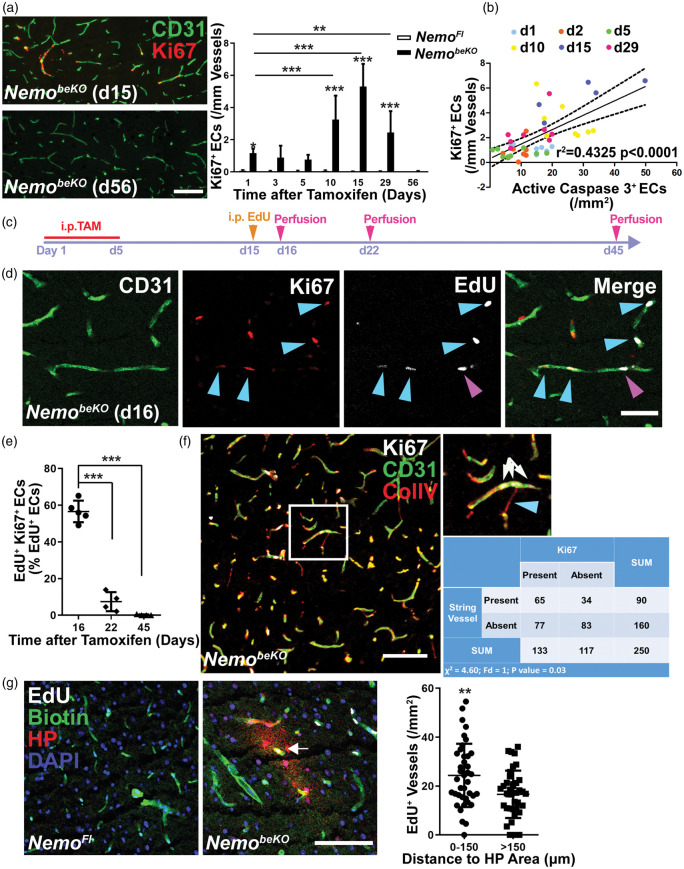
Figure 4.
Angiogenesis is associated with vessel loss and hypoxia in NemobeKO mice. (a) Left panels, representative immunostainings for Ki67 and CD31 demonstrating angiogenesis in the cortex of NemobeKO mice at day 15 after starting tamoxifen injections (d15) but not at day 56 (d56). Right panel, quantification of Ki67+ cells in vessels of the cortex of NemobeKO and NemoFl mice (n = 5–8) at seven time points after starting tamoxifen injections. Data are shown as means ± SD, *P < 0.05, **P < 0.01, ***P < 0.001, determined by two-way ANOVA with Bonferroni’s post-test. Scale bar, 100 μm. (b) Correlation between the number of Ki67+ ECs and active caspase 3+ ECs from NemobeKO mice at six time points, which are indicated by different colors (n = 45 mice). Values on the X-axis represent the numbers of active caspase 3+ cells in NemobeKO mice in a previous study,13 whereas the Y-axis shows the numbers of Ki67+ ECs from (a) that were quantified in sections from the same animals. Data are determined by Pearson correlation test. (c) Scheme illustrating the experimental strategy to determine Ki67 expression of EdU+ ECs. (d) Staining for EdU, Ki67, and CD31 revealed that EdU+ proliferating ECs in the cortex of NemobeKO mice differ in Ki67 expression at day 16 after starting tamoxifen injections. Some ECs that had incorporated EdU stopped proliferating (EdU+Ki67−, magenta arrowhead), others were still in mitosis (EdU+Ki67+, blue arrowheads). Scale bar, 50 μm. (e) Quantification of EdU+Ki67+ ECs in the cortex of NemobeKO mice (n = 4–5) at three time points after the start of tamoxifen injection demonstrated a gradual decrease in the number of the EdU+ ECs that sustained proliferation. Data are shown as means ± SD, ***P < 0.001, determined by one-way ANOVA with Bonferroni’s post-tests. (f) Immunostaining in the cortex of a NemobeKO mice showing that proliferating ECs (Ki67+CD31+) and string vessels (ColIV+CD31− string-like structures) were spatially associated. A representative image is shown, with a high magnification view of the white-framed region as inset. Blue arrowhead, string vessel; white arrows, vessel with proliferating ECs. In the analysis, 10 fields from 5 NemobeKO mice were analyzed. Scale bar, 100 μm. (g) Staining for biotin, hypoxia probe (HP), and EdU demonstrated proliferating vessels inside of hypoxic areas (white arrow) in the cortex of NemobeKO and not in NemoFl mice. Mice received an i.v. injection of sulfo-NHS-LC-biotin for vessel labeling. Nuclei were stained with DAPI. Quantification of proliferating vessels inside and outside of hypoxic areas (defined as regions within 150 μm of HP+ staining). Data are means ± SD (39 fields from 5 NemobeKO mice). **P < 0.01, determined by two-tailed unpaired t-test. Scale bar, 100 μm.

